
A voice can pass every lab test and still sound fake to your ear
It’s tempting to assume the math has this figured out. Feed an AI voice into a scoring tool, get a high number back, and surely that means the voice sounds human — right? That’s the assumption a lot of product pages quietly lean on when they wave a “studio-quality” or “near-human” score at you.
The problem is that PESQ and MOS — two numbers this field leans on — were built to answer different questions, and neither of them was designed to tell you “does this synthetic voice sound like a real person reading your script.” One measures how badly a signal got mangled on its way through a network. The other is a crowd of humans averaging their gut reactions. When a voice tool leans on the wrong one, you end up with clips that look great on a spreadsheet and still make listeners squirm three sentences in.
So here’s the honest version of how voice quality actually gets measured in 2026 — what PESQ and MOS really capture, how listening tests handle messy things like accent and emotion, which datasets the models get validated against, and why the gap between a lab score and your actual ear is baked into the metrics themselves.
Step 1: What PESQ really measures — and the three things it can’t see
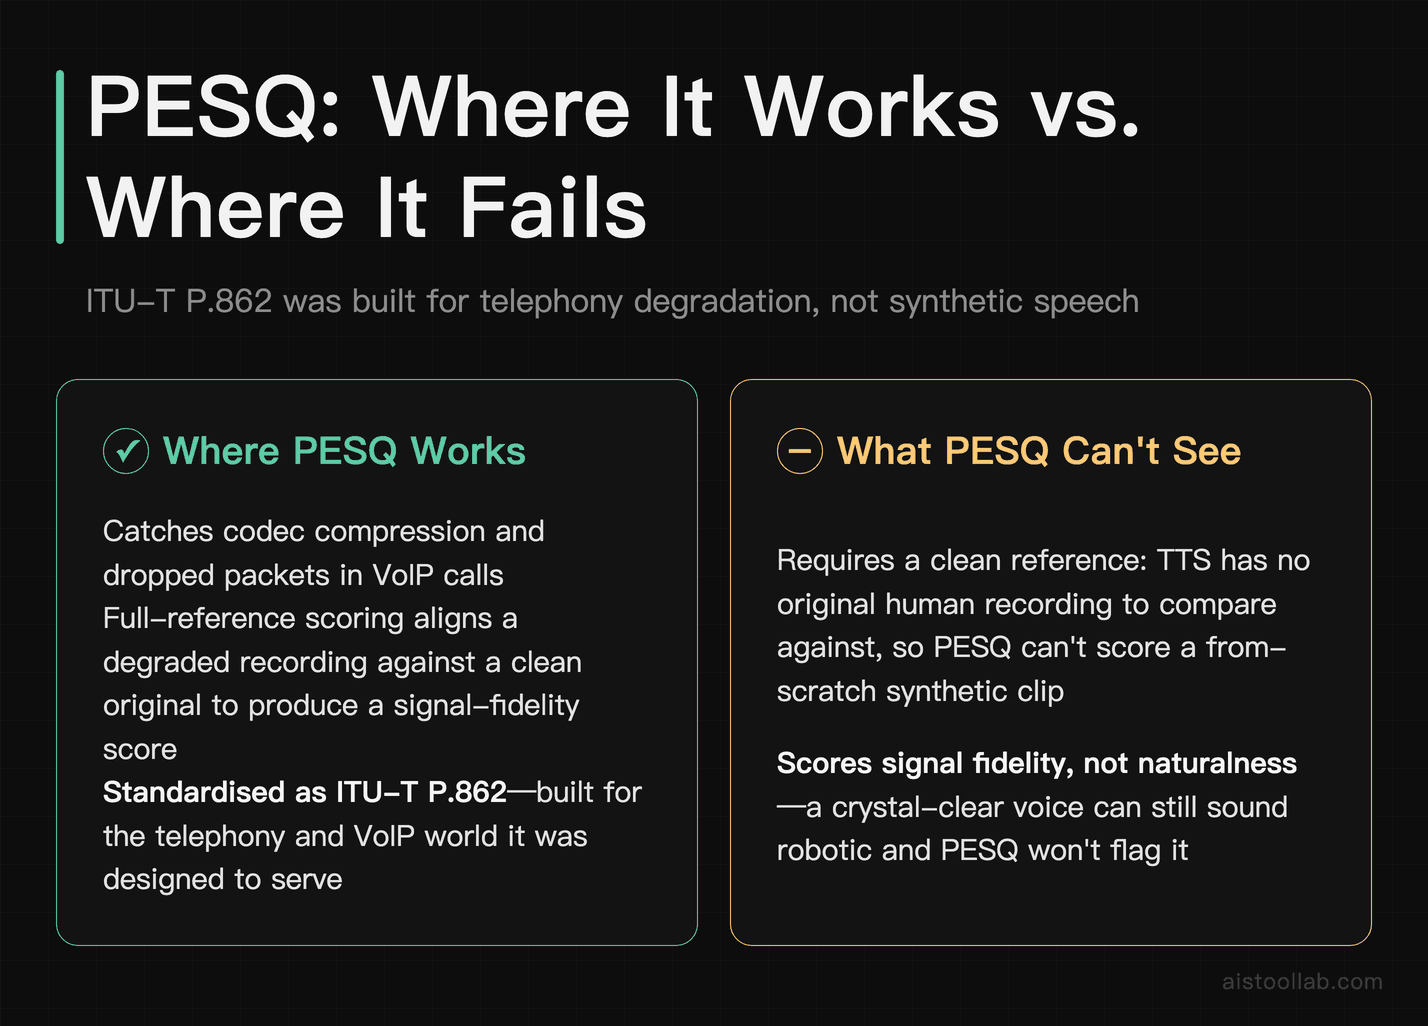
PESQ stands for Perceptual Evaluation of Speech Quality, and it’s standardized as ITU-T Recommendation P.862. The key word most people skip is Perceptual — it tries to model how a human would perceive degradation, but it does it entirely with math, no humans in the loop. It’s what engineers call a full-reference (or intrusive) metric: you feed it a clean reference recording and a degraded version, it aligns them, and it scores how far the degraded one drifted from the original.
That design tells you exactly what PESQ is good at and what it’s blind to. It was built for the telephony and VoIP world — to catch what happens to speech after it’s squeezed through a codec, dropped a few packets, or picked up line noise. In that context it’s genuinely useful. But three things fall straight through the cracks:
- There’s no clean reference for a synthetic voice. When an AI generates speech from text, there’s no “original human recording” to compare against. PESQ literally needs both signals to work, so it can’t score a from-scratch TTS clip the way it scores a phone call.
- It scores signal fidelity, not naturalness. A voice can be crystal-clear and perfectly intelligible while still landing every emphasis in the wrong place. PESQ doesn’t have an opinion about awkward prosody.
- It was tuned for narrower audio than modern voices use. P.862 grew up in the narrowband/wideband telephony era; the successor standard, ITU-T P.863 (POLQA), was introduced to handle wider bandwidths, and Google’s open-source ViSQOL took another crack at the same objective-scoring problem.
Here’s how the main players in speech-quality scoring actually differ — this is a map of methodology, not a leaderboard:
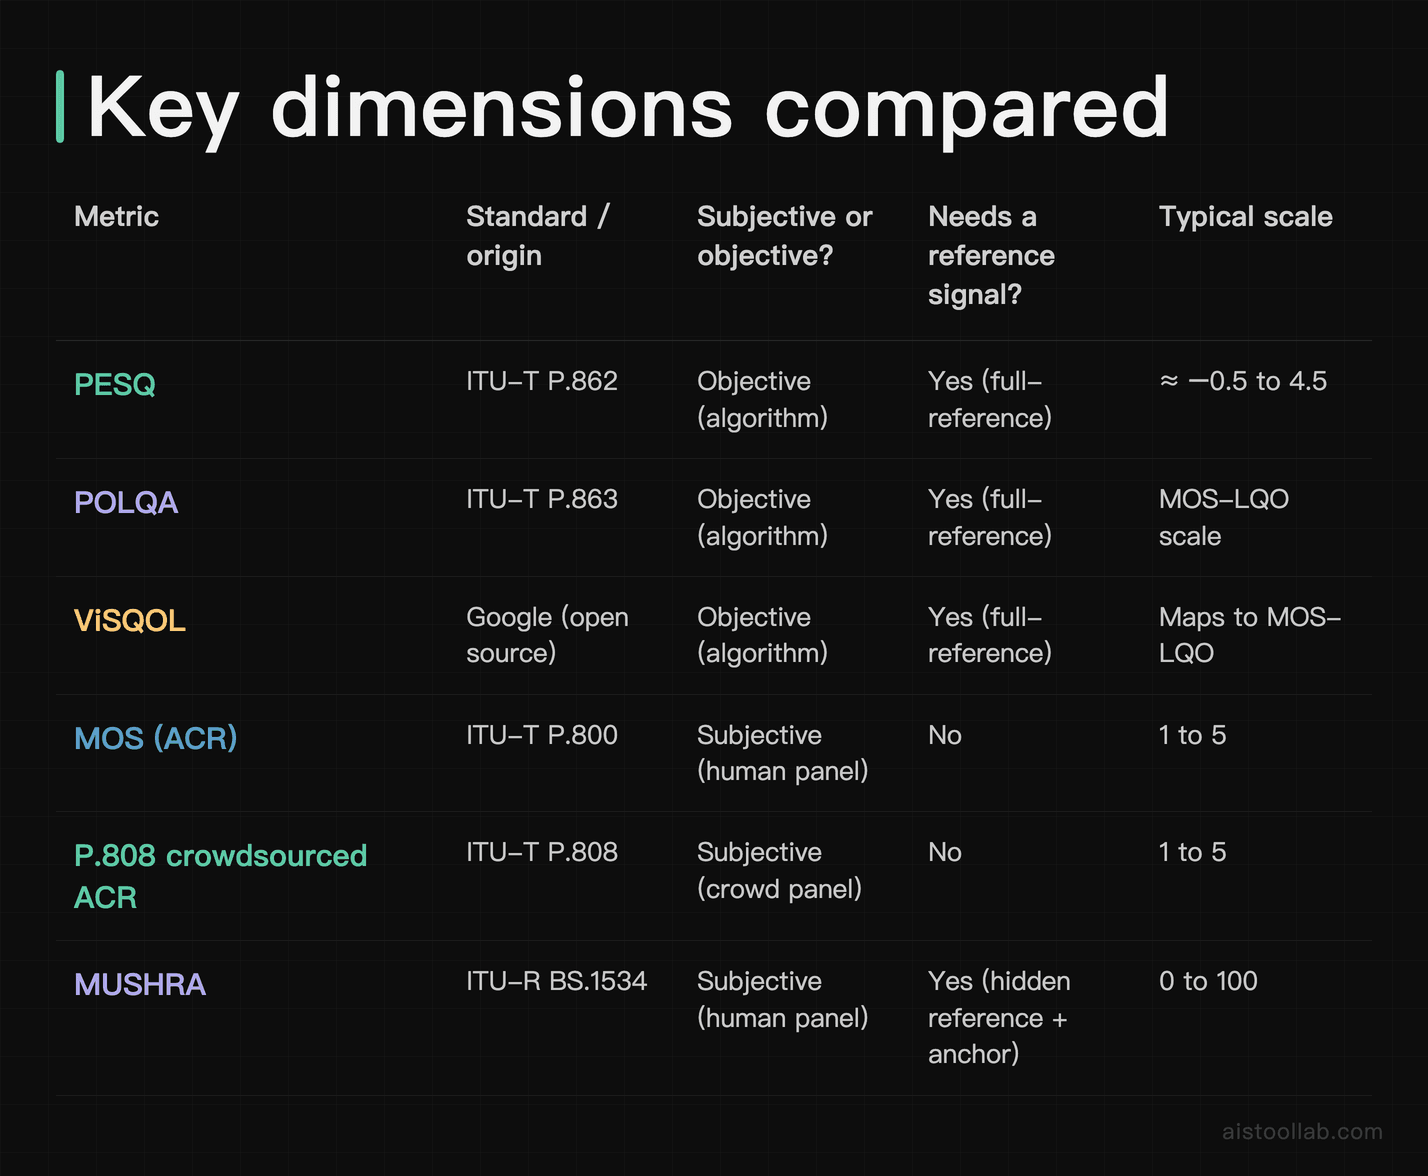
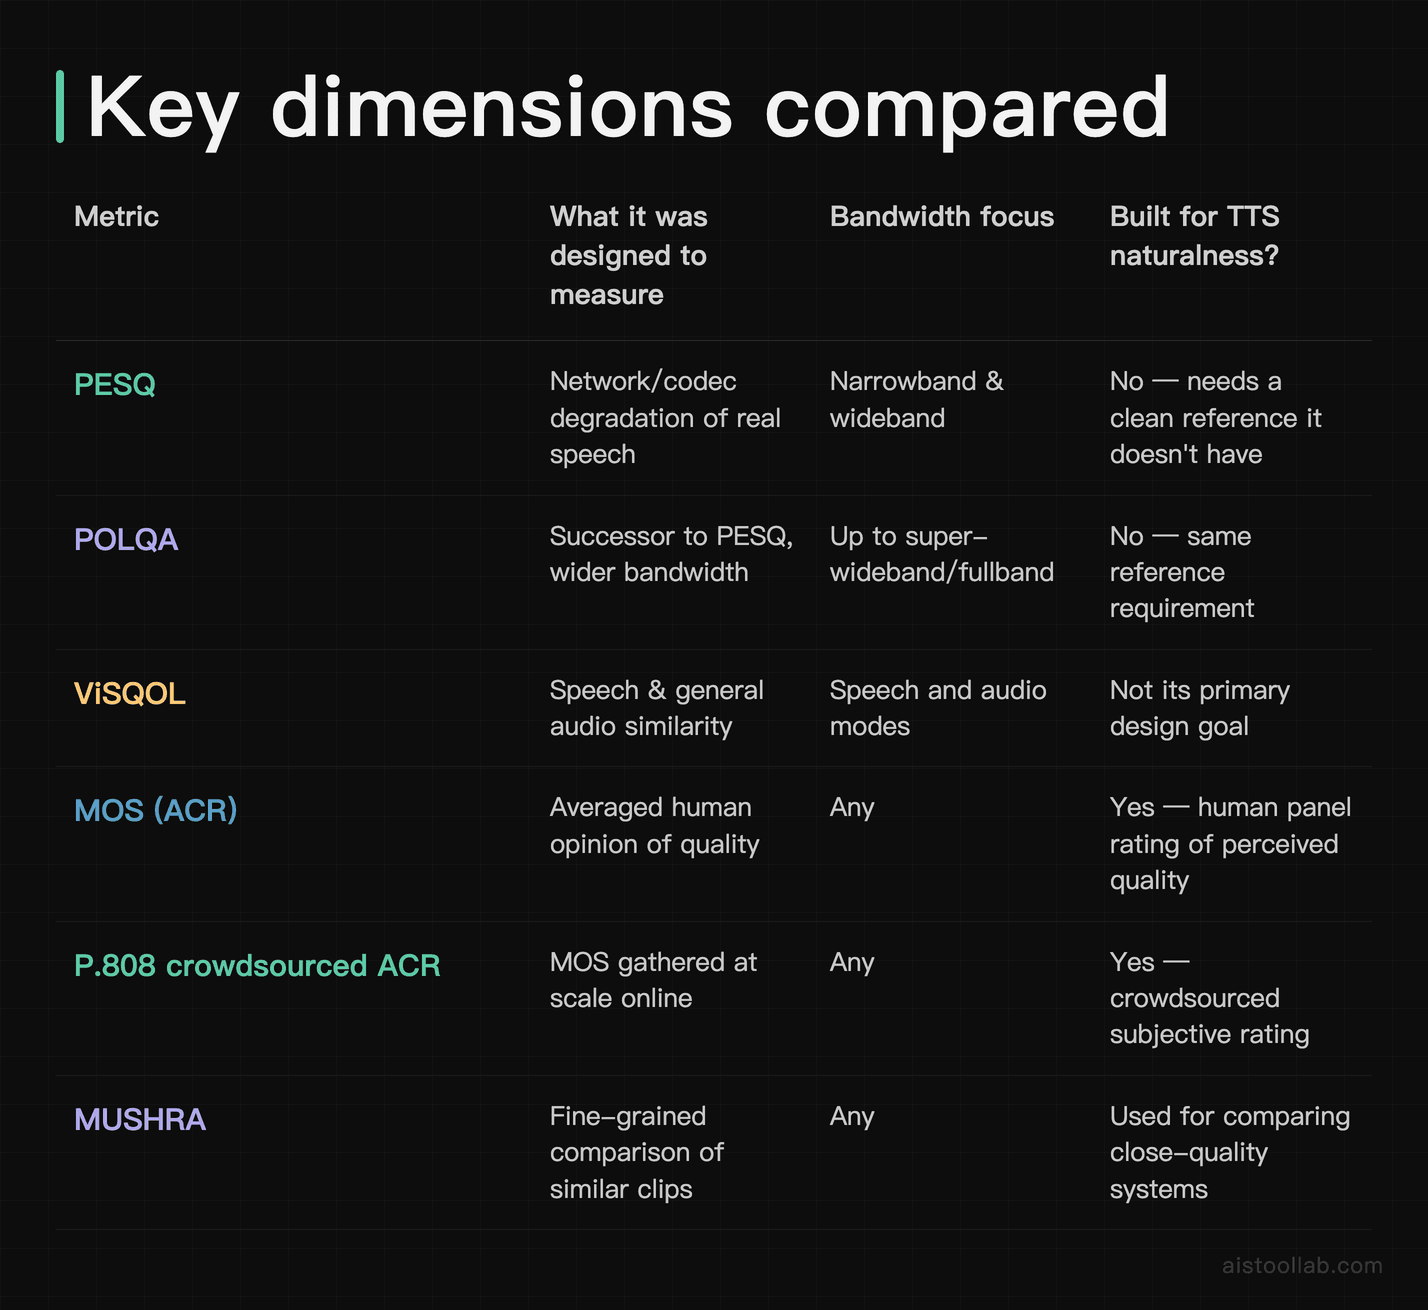
One useful thing to take from that table: PESQ and its objective cousins live in the “how much did a real recording degrade” column, and human MOS lives in the “how good does this sound to a person” column. A voice tool that quotes PESQ at you for its synthetic output is quoting a metric that was never built to answer the question you’re asking.
Step 2: MOS, listening tests, and how researchers score accent and emotion
MOS — Mean Opinion Score — is the number many teams report, and it’s refreshingly simple in concept: play a clip to a panel of listeners, ask them to rate it 1 (Bad) to 5 (Excellent), and average the scores. The protocol behind it is ITU-T P.800, which describes the Absolute Category Rating (ACR) method most naturalness tests still use. Because it’s humans doing the rating, MOS reflects subjective judgments that automated metrics are not designed to score — that a voice sounds “off,” that the intonation feels flat, that an otherwise clean clip has a weirdly robotic cadence.
But “ask some people” hides a lot of methodology. A few of the protocols that shape those scores:
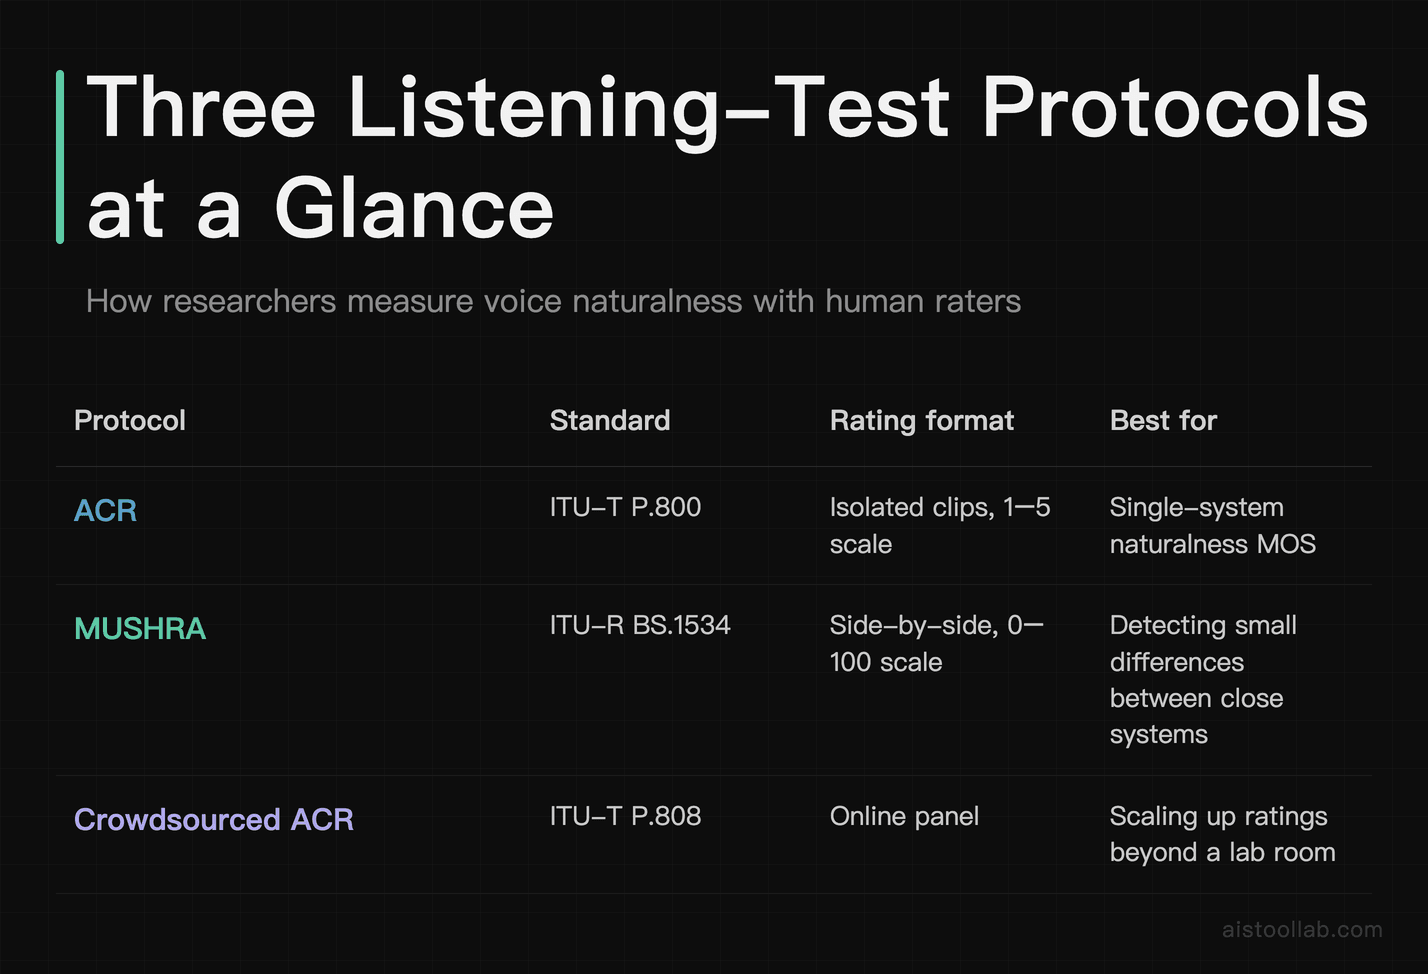
- ACR (P.800) plays each clip on its own and asks for an absolute rating. It’s a common way to report a single naturalness MOS.
- MUSHRA (ITU-R BS.1534) plays several versions side by side with a hidden reference and a deliberately degraded “anchor,” and asks listeners to rate them on a 0–100 scale. It’s often used when two systems are close and you need to tease apart small differences.
- Crowdsourced ACR (ITU-T P.808) moves the whole thing online so researchers can gather more ratings than a lab room allows. Microsoft released an open-source P.808 toolkit for this approach to TTS work.
The genuinely hard part is everything beyond “clean vs. clean.” Naturalness and intelligibility are not the same axis — a heavily accented voice can be perfectly natural and slightly harder to parse, or crisp and intelligible while sounding synthetic. Good listening-test design controls for this by separating the questions: rate naturalness here, transcribe what you heard there (intelligibility is often measured by word-error rate on human transcriptions rather than a 1–5 opinion).
Accent, emotion, and context each break the simple single-number model in their own way. Accent introduces listener bias — a panel recruited in one region may rate an unfamiliar accent lower on “naturalness” for reasons that have nothing to do with synthesis quality, so serious studies balance their panels and report demographics. Emotion is judged less by “is this good” and more by “did the intended emotion come across,” which is a recognition task, not a quality rating. And context matters enormously: a voice rated 4.5 on isolated ten-second clips can fall apart across a two-minute paragraph, because listeners start noticing repetition, breath timing, and prosodic monotony that never showed up in a short sample. This is exactly why community events like the Blizzard Challenge and the VoiceMOS Challenge exist — to evaluate TTS systems on shared material under controlled listening protocols rather than trusting each vendor’s own demo reel.
Step 3: The datasets, ITU-T standards, and the lab-to-living-room gap
Models don’t get validated on vibes. There’s a fairly standard toolkit of public corpora and reference standards that voice research leans on, and knowing the names helps you read a technical claim critically.
The corpora models are trained and tested against
A handful of open datasets show up again and again: the CSTR VCTK corpus (many English speakers with varied accents, from the University of Edinburgh), LibriSpeech (read English derived from public-domain audiobooks), and LJSpeech (a single-speaker English set) are common training and benchmarking material. For quality modelling specifically, there are datasets built to predict human ratings — NISQA, a non-intrusive (no-reference) speech-quality model and dataset from work at TU Berlin, is one example of the push to score quality without needing a clean reference, precisely because synthetic speech doesn’t come with one.
The standards that make numbers comparable
On the reference-signal and methodology side, ITU-T recommendations do the standardizing work: P.800 for subjective MOS methods, P.808 for crowdsourced MOS, P.862/P.863 for the objective PESQ/POLQA algorithms, and test-signal specs like ITU-T P.501 that define the reference material used in intrusive testing. When a paper says “MOS was collected per ITU-T P.808,” that’s a real, checkable claim about how the scores were gathered — unlike a bare “4.7 MOS” floating free of any protocol.
Why a high score can still sound artificial
Here’s a gap that’s easy to overlook: every one of these metrics compresses a rich, time-varying experience into a scalar, and scalars lose information. A voice can top the charts on short-clip MOS and still feel artificial in the wild for reasons the test never sampled — prosody that’s correct on average but wrong on your specific sentence, a “uncanny valley” smoothness where the absence of small human imperfections reads as eerie, listener fatigue over long-form content, and mismatch between the test material and your actual use case. A model benchmarked on calm read-aloud audiobook sentences can score beautifully and then stumble on a punchy ad script full of numbers, brand names, and exclamation points. The score was real; it just answered a question about a different kind of speech than the one you’re about to publish.
Who actually needs to read these scores
This isn’t only an academic concern. A few concrete situations where the metric behind a number changes your decision:
- Say you’re a solo podcaster choosing a TTS voice for intros and ad reads. A vendor’s MOS on ten-second clips measures short-clip quality, not how the voice holds up across a three-minute segment. The move is to generate your own longest realistic script and listen to the whole thing — fatigue and prosody problems can surface over longer stretches. If you’re already editing audio by text, the workflow around this is close to what I covered in the Descript Free Plan Review.
- Imagine you’re a product engineer shipping voice inside an app. If your audio travels over a call or a compressed stream, then PESQ/POLQA-style objective metrics genuinely apply to the delivery path — but they still won’t tell you whether the underlying synthetic voice sounds human. You’re measuring two different things and need both.
- If you’re an accessibility lead evaluating a screen-reader or IVR voice, intelligibility outranks naturalness, and accent coverage matters more than a headline MOS. Here you’d weight word-error-rate-style measures and test with the accents your actual users speak, not the panel the vendor happened to recruit.
In every case the pattern is the same: figure out which question the published number actually answers, then run the one test the number skipped. If you’re comparing commercial options, the free tiers are usually enough to do exactly that — the Murf AI Review walks through where one such plan’s limits kick in. And if you’re curious how researchers formalize this kind of “which metric fits which task” reasoning at scale, the same evidence-first mindset shows up in How Do AI Agents Choose and Use Tools.
Read the score, then listen anyway
Metrics tell you which question a number answered; your own ears, on your own longest script, tell you whether the voice is right for the job — run both.
Frequently Asked Questions
Is a higher MOS score always better?
Higher is generally better on the axis MOS measures, but “better” only means “this panel of listeners, rating these clips, under this protocol, preferred it.” A 4.6 collected on calm, isolated read-aloud sentences is not directly comparable to a 4.2 collected on emotional, long-form, or accented material — the harder test naturally pulls scores down even for a genuinely good voice. Sample size, listener demographics, whether the test was ACR or MUSHRA, and the length of the clips all move the number. That’s why serious papers report the protocol alongside the score and include confidence intervals. My practical rule when I’m reading a claim: treat any MOS quoted without its method as marketing, not data. If two tools quote MOS from different studies, you basically can’t compare them head-to-head — you’d need both voices tested on the same material under the same protocol before the comparison means anything.
Why don’t voice AI companies just use PESQ for their TTS models?
Because of how PESQ is defined, it doesn’t fit the way text-to-speech is generated. It’s a full-reference metric defined in ITU-T P.862 — it requires a clean “original” recording to compare a degraded version against, and it scores how far the degraded signal drifted. When a model generates a voice from text, there is no original human recording of that exact sentence in that exact voice to compare to, so the metric has nothing to anchor on. PESQ also measures signal-level degradation from things like codecs and packet loss, not naturalness or prosody, which are precisely what makes synthetic speech sound off. That mismatch is why the field leans on human MOS (per ITU-T P.800/P.808) for naturalness and increasingly on non-reference models like NISQA that were built to score quality without needing a pristine reference. PESQ still has a legitimate home — evaluating how speech survives a network or a codec — it’s just the wrong instrument for “does this AI voice sound human.”
What’s the difference between MOS and PESQ in plain English?
MOS is people; PESQ is math. MOS — Mean Opinion Score — is literally a room (or an online crowd) of human listeners rating clips 1 to 5 and averaging the result, defined by ITU-T P.800. It captures subjective impressions from human listeners, like “this sounds robotic.” PESQ, defined by ITU-T P.862, is an algorithm that estimates perceived quality by comparing a degraded signal to a clean reference — no humans in the loop at rating time. There’s a middle category worth knowing too: MOS-LQO, which is a MOS-like number predicted by an objective model rather than gathered from people. The short version: use human MOS when you want to know whether a voice sounds natural to a person, and use PESQ/POLQA when you want to know how much a real recording degraded traveling through a system. They’re not competitors; they answer different questions, and confusing the two is how a technically clean voice ends up sounding artificial in production.
Can I run these tests myself without a research lab?
Partly, yes. You can’t easily replicate a controlled listening study — that needs recruited, balanced panels and careful protocol design — but you can borrow the ideas. For subjective evaluation, the ITU-T P.808 approach (crowdsourced ACR) exists precisely to scale MOS collection online, and Microsoft open-sourced a P.808 toolkit that some teams use to gather ratings. For objective scoring on a delivery path, open implementations of PESQ-style metrics and Google’s open-source ViSQOL are available if you have a clean reference to compare against. Honestly, though, one useful “test” for most people isn’t a formal metric at all: generate your own longest, messiest, most realistic script — the one with numbers, names, and emotion — and listen to the whole thing on the device your audience will use. That informal test lets you hear how fatigue and prosody hold up across a full-length script rather than a short clip, and it costs you nothing but a few minutes.
What datasets do AI voice tools train and validate on?
A handful of public corpora recur across the field. For English, the CSTR VCTK corpus (many speakers with varied accents, from the University of Edinburgh), LibriSpeech (read speech derived from public-domain LibriVox audiobooks), and LJSpeech (a single-speaker set) are common training and benchmarking material. For quality prediction specifically, there are purpose-built datasets that pair audio with human ratings so models can learn to predict MOS — NISQA, from work at TU Berlin, is one non-intrusive example. On the evaluation side, shared community events like the Blizzard Challenge and the VoiceMOS Challenge put multiple systems through the same listening protocols on common material, in contrast to each vendor’s self-selected demo. Bear in mind most of these are English-heavy and read-speech-heavy, so a model that shines on them can still wobble on other languages, spontaneous speech, or expressive delivery. When a tool cites a benchmark, it’s worth asking whether that benchmark resembles your actual content.
Why does a voice with a great score still sound artificial to me?
Because a score is a compression, and compression loses detail. Every metric here squeezes a rich, time-varying listening experience into one number, and the things that make a voice feel artificial often live in exactly the parts that got averaged away: prosody that’s fine on average but wrong on your specific sentence, an uncanny smoothness where the absence of tiny human imperfections reads as eerie, and fatigue that only appears over long passages. There’s also test-material mismatch — a voice benchmarked on calm read-aloud sentences can score beautifully and then stumble on a punchy script full of numbers and exclamation points. And there’s you: your ear, your familiarity with the content, your device, your expectations. None of that was in the lab panel. The score wasn’t lying; it answered a question about a certain kind of speech under certain conditions, and your real use case sits somewhere the test never sampled. That gap is structural, not a bug you can benchmark away.
Do PESQ and MOS measure emotion or accent quality?
Not directly, and this trips people up. Standard PESQ doesn’t touch emotion or accent at all — it scores signal degradation against a reference, full stop. Standard naturalness MOS (ACR) asks “how good does this sound,” which can be swayed by emotion and accent but doesn’t isolate them. Measuring those properly needs different task designs. Emotion is usually evaluated as a recognition task — did listeners correctly identify the intended emotion — rather than a 1-to-5 quality rating, because “natural” and “correctly expressive” are separate questions. Accent is even trickier, because it interacts with listener bias: a panel unfamiliar with an accent may rate it lower on naturalness for reasons unrelated to synthesis quality, so careful studies balance their panels and report demographics. If accent coverage or emotional range is what you actually need — say, for a global product or an audiobook — don’t trust a single headline MOS. Test with the accents and emotional scripts your real audience will hear, and evaluate recognition and intelligibility separately from raw naturalness.
Last updated: 2026
This is one way to choose.
👉 Browse the AI Tools Library to see what else is worth a look.