Who this is for: you are ready to run your own evaluation and want the end-to-end sequence, including the parts most people skip: confidence intervals, A/B tests and regression monitoring after launch.
What feeds into and out of this workflow:
- The Hugging Face Model Hub route — where the candidate models come from
- The production side — the operational metrics this workflow feeds
- Benchmarks mapped to roles — choosing which published scores to weight first
Contents
The Benchmark That Lied to Your Whole Team
Picture this: your team picks a model because it tops the MMLU leaderboard. Three weeks later, your support chatbot is confidently making up refund policies, your latency is double what the demo promised, and someone on Slack asks the dreaded question — “wait, why did we choose this one again?” The benchmark said it was the best. Production said otherwise.
This happens constantly, and it’s not because benchmarks are useless. It’s because most people read them like a sports scoreboard — bigger number wins — when they should be reading them like a clinical trial, with all the asterisks, sample sizes, and “results may not generalize” caveats that implies. A model scoring 89.2 on a reasoning benchmark versus one scoring 88.7 tells you almost nothing about which will serve your actual users better. The gap is often statistical noise dressed up as a ranking.
So let’s fix that. What follows is a practical, repeatable workflow for evaluating AI model performance the way the people who actually deploy these things do it — reading benchmarks for what they predict, building your own evaluation harness, running honest A/B tests on your own data, and catching regressions before your customers do. No PhD required, but I’m not going to dumb it down either.
What This Workflow Actually Solves
Standard benchmark-reading answers the question “which model is smartest in the abstract?” That’s the wrong question. The right question is “which model is best for my task, at my latency budget, on my data, at a price I can defend to whoever signs the checks?”
The techniques here close the gap between published leaderboard scores and real production behavior. You’ll learn to translate abstract benchmark numbers into predictions about your use case, identify when a score difference is meaningful versus when it’s rounding error, and set up monitoring so you catch model drift and silent regressions instead of finding out from an angry user review. If you’ve read the AI Model Performance Metrics Explained 2026 primer on what MMLU and HellaSwag measure, this is the advanced sequel — less “what is it” and more “what do I do with it.”
This isn’t theoretical. By the end you should have a checklist you can run on any model you’re evaluating, whether that’s a frontier API or an open-weights model you’re self-hosting.
Stage one — treat each public benchmark as a proxy, and name what it predicts
Each major benchmark is a proxy for a real-world capability, and the trick is knowing which capability. Reading them at face value is how you end up surprised.
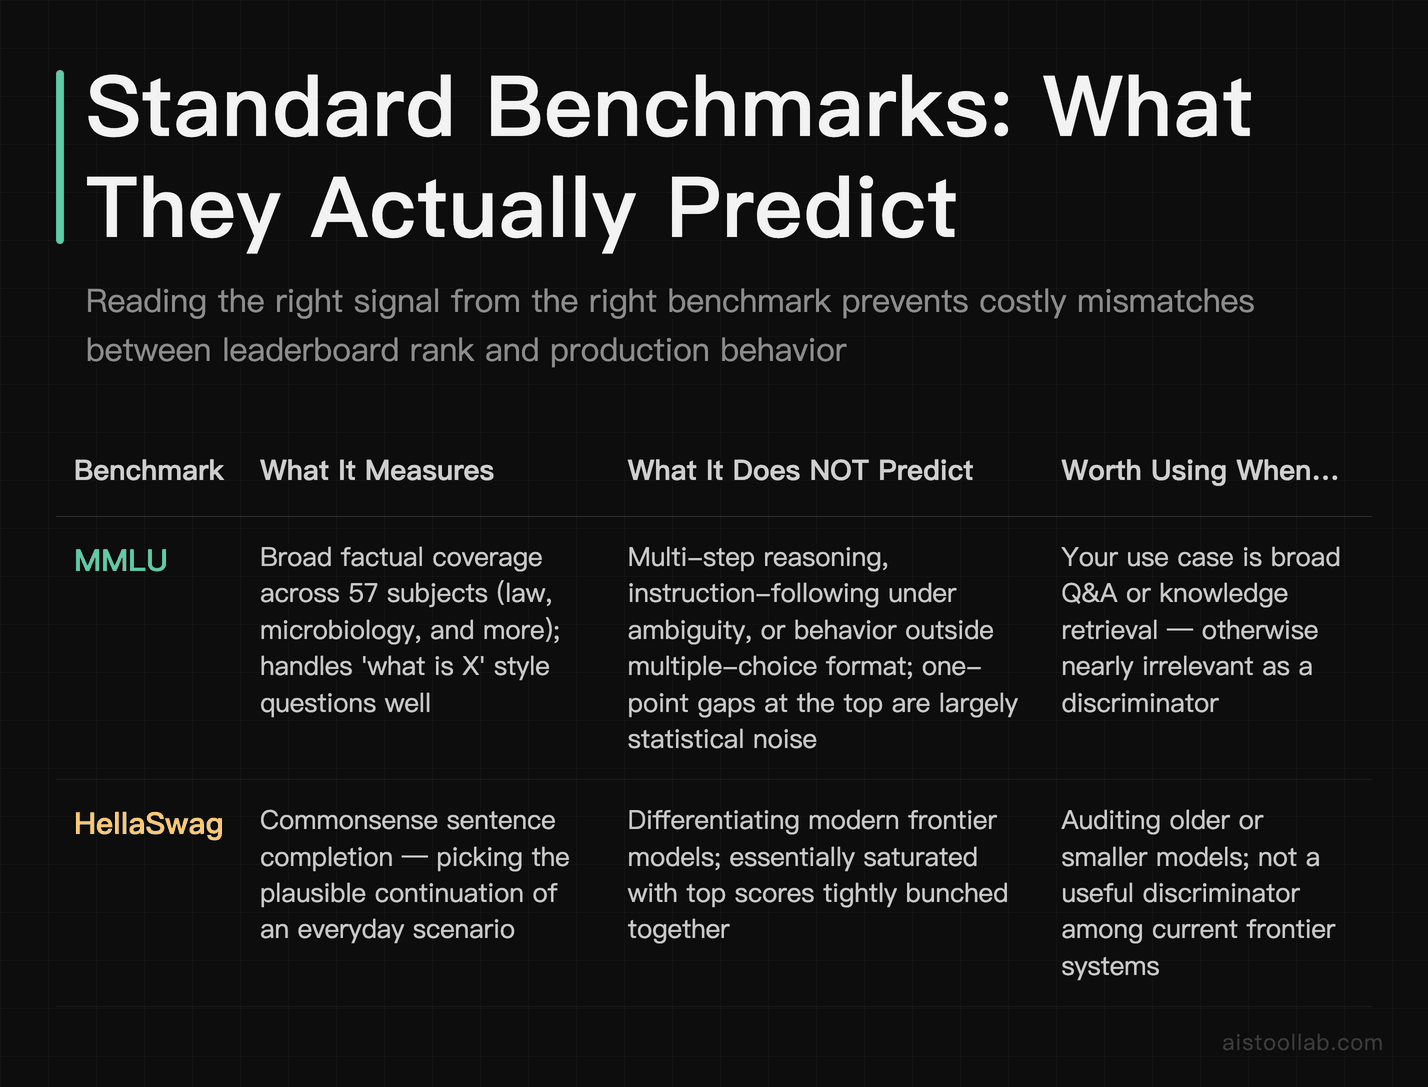
MMLU — broad knowledge, not reasoning depth
MMLU (Massive Multitask Language Understanding) is a multiple-choice exam across 57 subjects, from law to microbiology. A high score predicts that a model has broad factual coverage and can handle “what is X” style questions across domains. What it does not predict well: multi-step reasoning, instruction-following under ambiguity, or how the model behaves on questions outside the multiple-choice format. Top frontier models now cluster very tightly at the top of MMLU, which means it has largely saturated as a discriminator — a one-point difference between leading models is mostly noise. If your use case is broad Q&A or knowledge retrieval, MMLU is a reasonable first filter. If it’s anything else, it’s nearly irrelevant.
HellaSwag — commonsense, mostly saturated
HellaSwag tests commonsense sentence completion — picking the plausible continuation of an everyday scenario. It was genuinely hard for older models and is now essentially solved by frontier systems, with top scores bunched near the ceiling. Treat a high HellaSwag score as table stakes, not a differentiator. A model that fails HellaSwag is a red flag; a model that aces it has simply met a minimum bar most modern models clear.
MATH and GSM8K — actual reasoning signal
This is where the scores still spread out meaningfully. MATH (competition-level problems) and GSM8K (grade-school word problems) require multi-step symbolic reasoning, and they remain a strong predictor of how a model handles chained logic, structured planning, and tasks where one early mistake cascades. If your application involves data analysis, agentic workflows, or anything where the model has to “think” across several steps, weight these heavily. A genuine gap here usually shows up in production.
Code benchmarks — read the eval method, not just the number
HumanEval and the more rigorous SWE-bench measure coding ability, but they measure very different things. HumanEval is small, isolated function-writing; SWE-bench tests whether a model can resolve real GitHub issues across a full repository. A model can crush HumanEval and still flail on SWE-bench, because real engineering is about context, not party-trick functions. If you’re building developer tooling, SWE-bench-style results predict real-world usefulness far better — I dig into this distinction in the Open LLM Leaderboard Review 2026.
Stage two — find the binding constraint: quality, latency or cost
Accuracy is only one axis, and for many production systems it’s not even the binding constraint. Here’s the uncomfortable truth: the “best” model on quality benchmarks is frequently the wrong choice once you factor in latency, cost, and throughput.
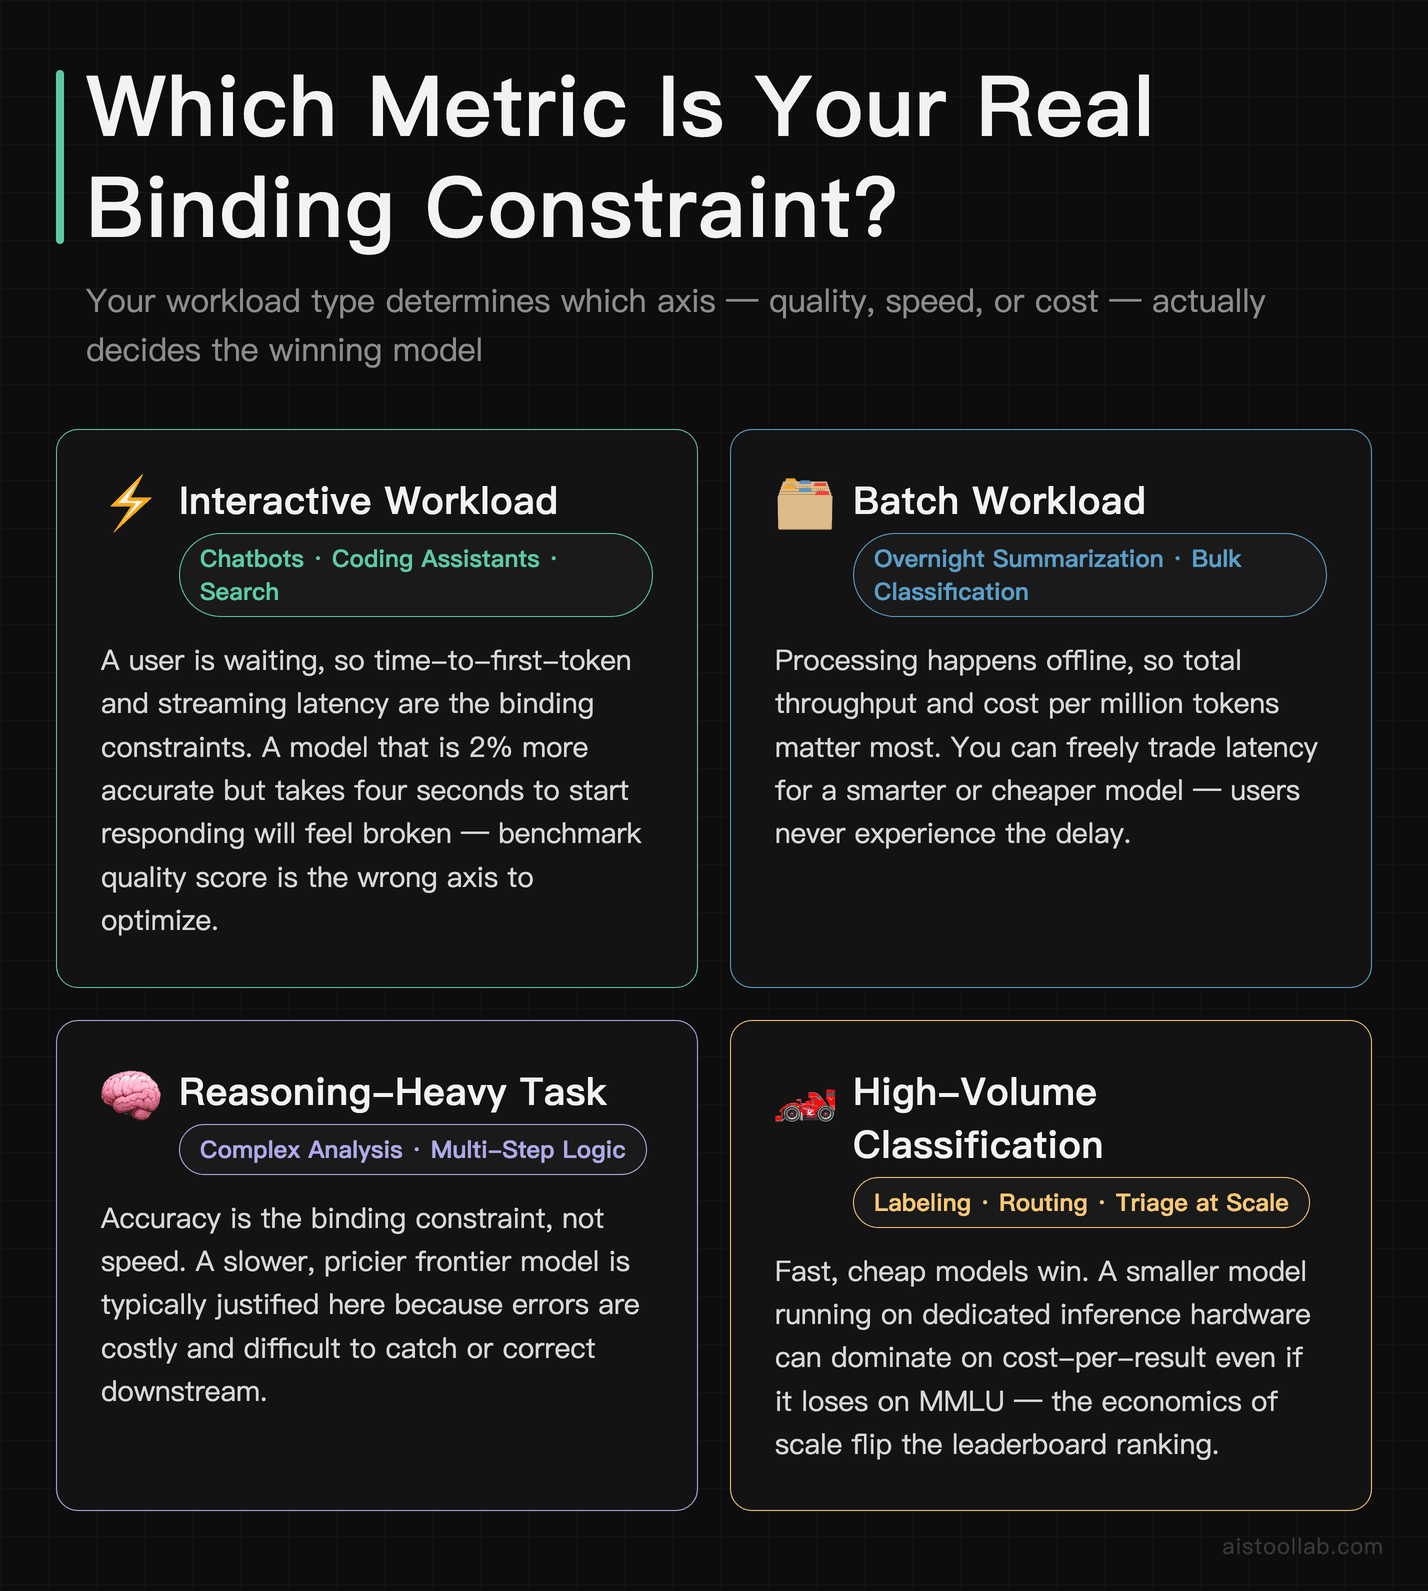
Start by classifying your workload. Is it interactive (a user is waiting — chatbots, coding assistants, search) or batch (processing happens offline — document summarization overnight, bulk classification)? For interactive work, time-to-first-token and streaming latency matter enormously; a model that’s 2% more accurate but takes four seconds to start responding will feel broken. For batch work, you care about total throughput and cost per million tokens, and you can happily trade latency for a smarter or cheaper model.
Then map the tradeoffs explicitly. A reasoning-heavy task justifies a slower, pricier model. A high-volume classification task screams for a fast, cheap one — and a smaller model running on dedicated inference hardware can win badly on cost-per-result even if it loses on MMLU. If raw speed is your bottleneck, it’s worth reading my Groq AI Inference Platform Review 2026, because the inference layer often matters more than the model choice.
Write down your priority order before you measure anything. “Accuracy first, then latency under 800ms, then cost” is a decision rule. “Whatever’s best” is not.
What you need in place before stage three
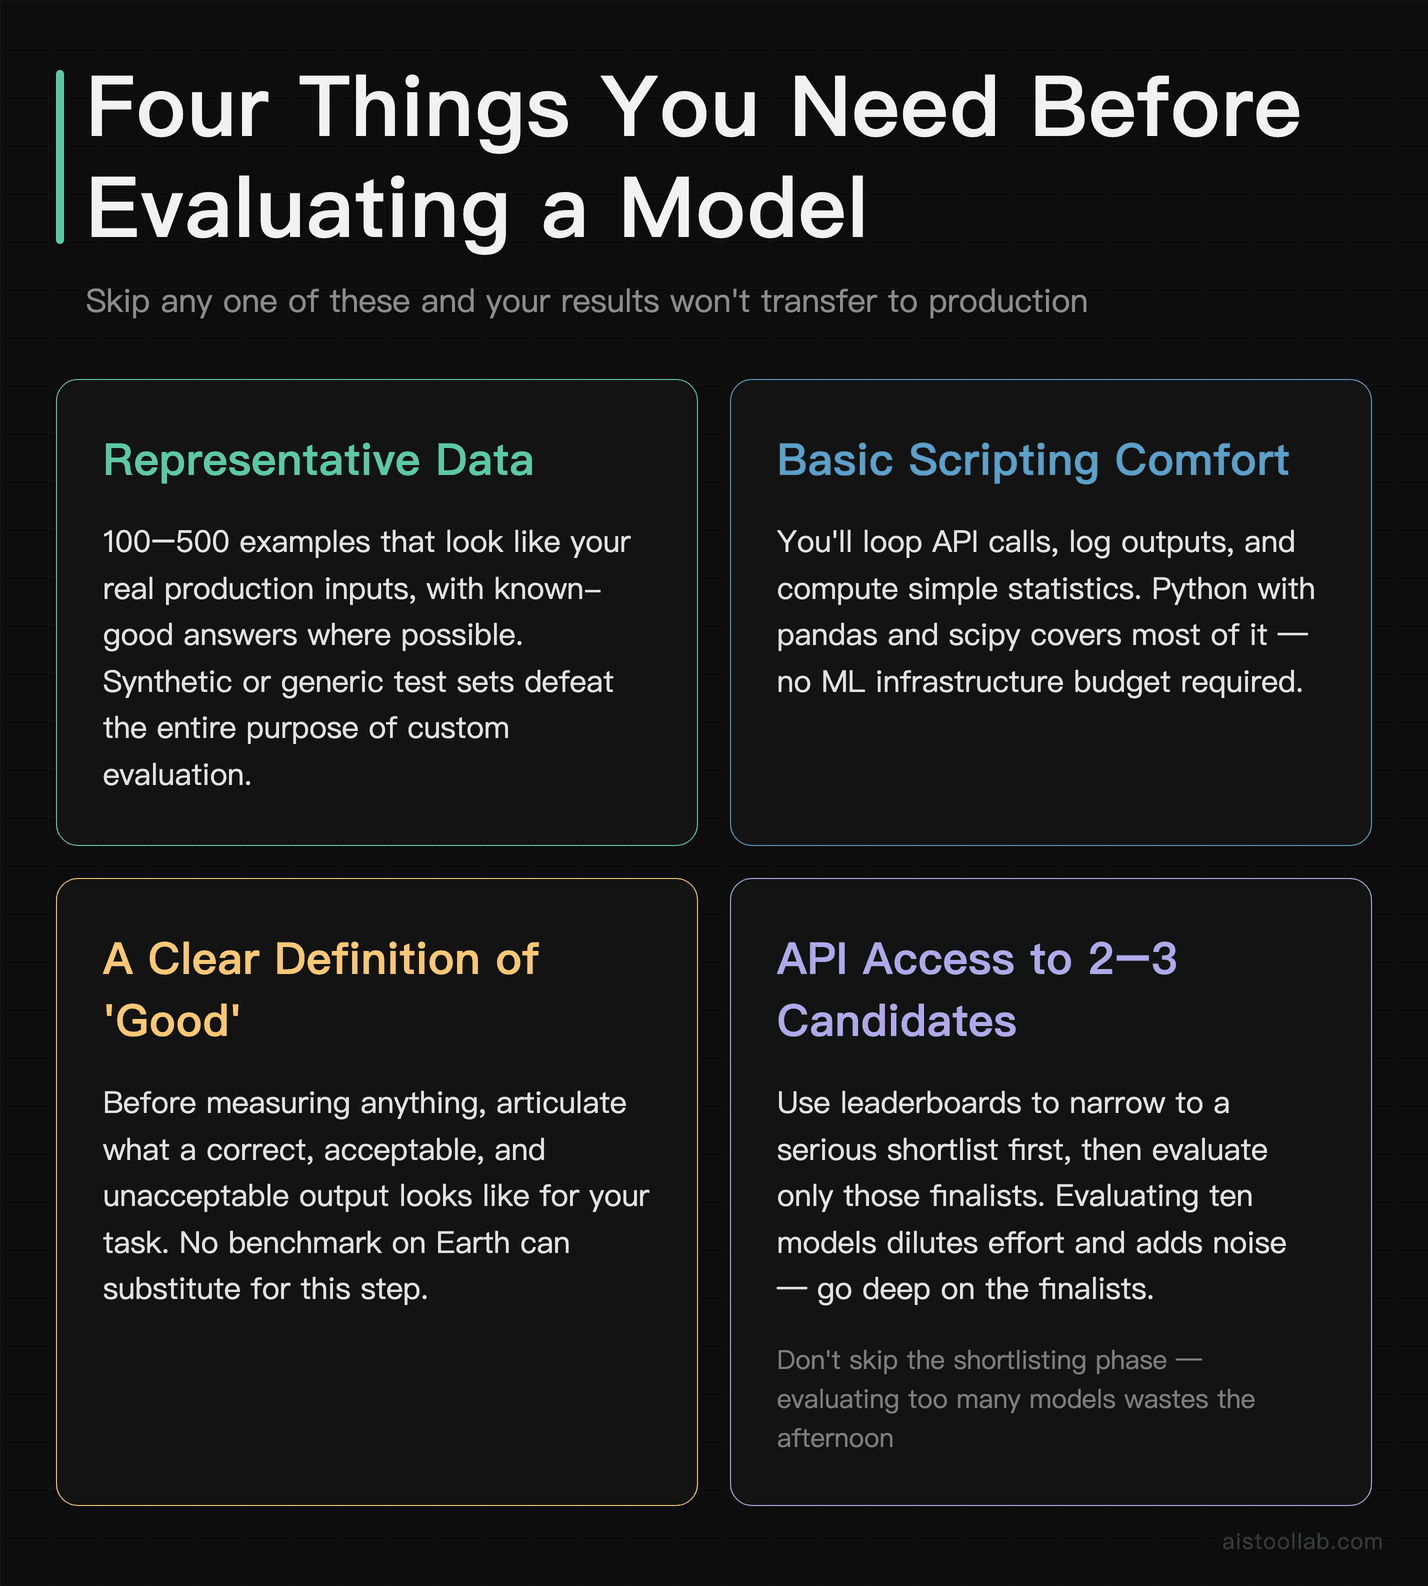
You don’t need a massive infrastructure budget, but you do need a few things in place. First, a representative sample of your real data — ideally 100 to 500 examples that look like what your model will actually see in production, with known-good answers where possible. Synthetic or generic test sets defeat the entire purpose.
Second, basic scripting comfort. You’ll be making API calls in a loop, logging outputs, and computing simple statistics. Python with libraries like pandas and scipy covers most of it. Third, a clear definition of “good” for your task — and this is the step everyone skips. If you can’t articulate what a correct, acceptable, and unacceptable output looks like before you start measuring, no benchmark on Earth will save you.
Finally, API access (or local model access) to the two or three candidates you’re seriously considering. Don’t evaluate ten models. Use leaderboards to narrow to a shortlist, then go deep on the finalists.
Stage three — build a harness on 100–500 of your own examples
This is the step that separates pros from leaderboard tourists. Public benchmarks tell you about generic capability; your eval set tells you about your reality.
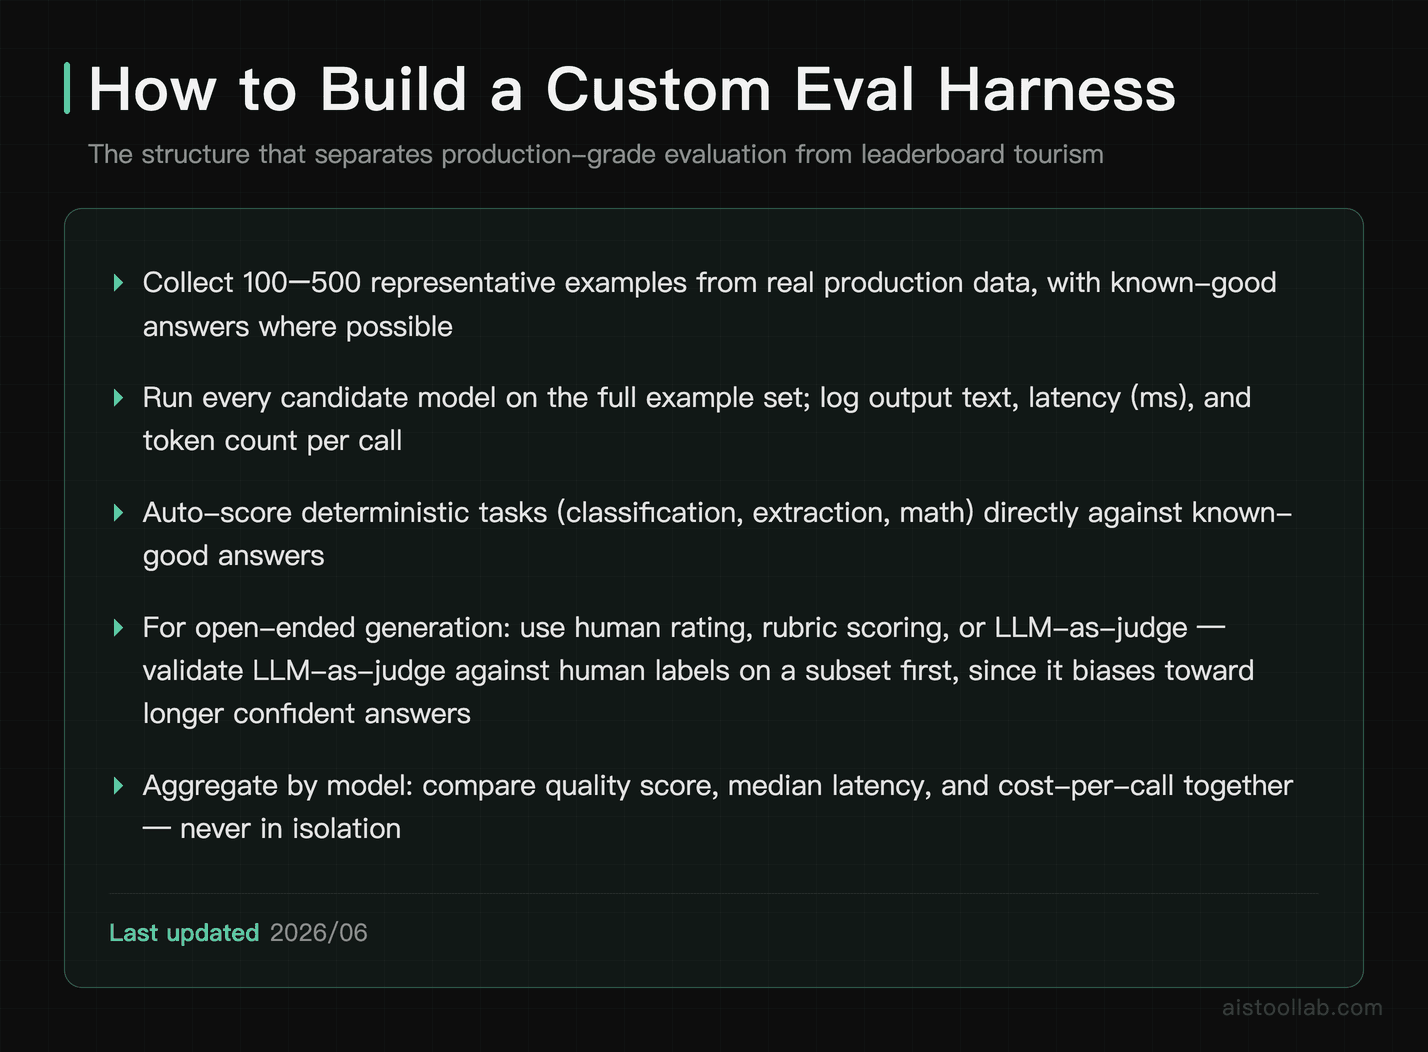
The basic structure is simple. Collect your representative examples, run each candidate model on all of them, and score the outputs against your definition of “good.” For tasks with clear correct answers (classification, extraction, math), scoring is automatable. For open-ended generation, you have three options: human rating, rubric-based scoring, or “LLM-as-judge” — using a strong model to grade outputs against a rubric. LLM-as-judge is fast and surprisingly consistent, but validate it against human judgment on a subset first, because it carries its own biases (it tends to favor longer, more confident answers).
A minimal harness looks like this:
import pandas as pd

results = []
for example in test_set:
    for model in candidate_models:
        output = call_model(model, example["prompt"])
        score = grade(output, example["expected"])
        results.append({
            "model": model,
            "id": example["id"],
            "score": score,
            "latency_ms": output.latency,
            "tokens": output.token_count,
        })

df = pd.DataFrame(results)
print(df.groupby("model")[["score", "latency_ms"]].mean())
Run each example a few times, not once — model outputs are stochastic, and a single run can mislead you badly. Log latency and token counts alongside scores so you’re evaluating quality, speed, and cost in one pass. This harness becomes a reusable asset: every time a new model drops, you point it at your test set and get a grounded answer in an afternoon instead of trusting a press release.
Stage four — route real traffic and measure outcomes, not impressions
Offline evaluation gets you a shortlist; an A/B test gets you the truth. If you can, route a slice of real production traffic to each candidate and measure outcomes that actually matter to the business — task completion rate, user thumbs-up/down, escalation-to-human rate, conversion. These downstream metrics correlate with revenue in a way that no benchmark does.
The discipline here is keeping everything else constant. Same prompts, same retrieval context, same temperature settings, same user segments. If you change the model and the prompt template at the same time, you’ve learned nothing about either. Run the test long enough to gather a meaningful sample across different times of day and user types, because performance often varies by traffic pattern.
One trap worth flagging: don’t peek and stop early the moment one model looks ahead. Early leads vanish all the time. Decide your sample size in advance and let the test run.
Stage five — the tells that a number is lying to you
Here’s the section that, if you internalize nothing else, will make you better than most people who do this professionally.
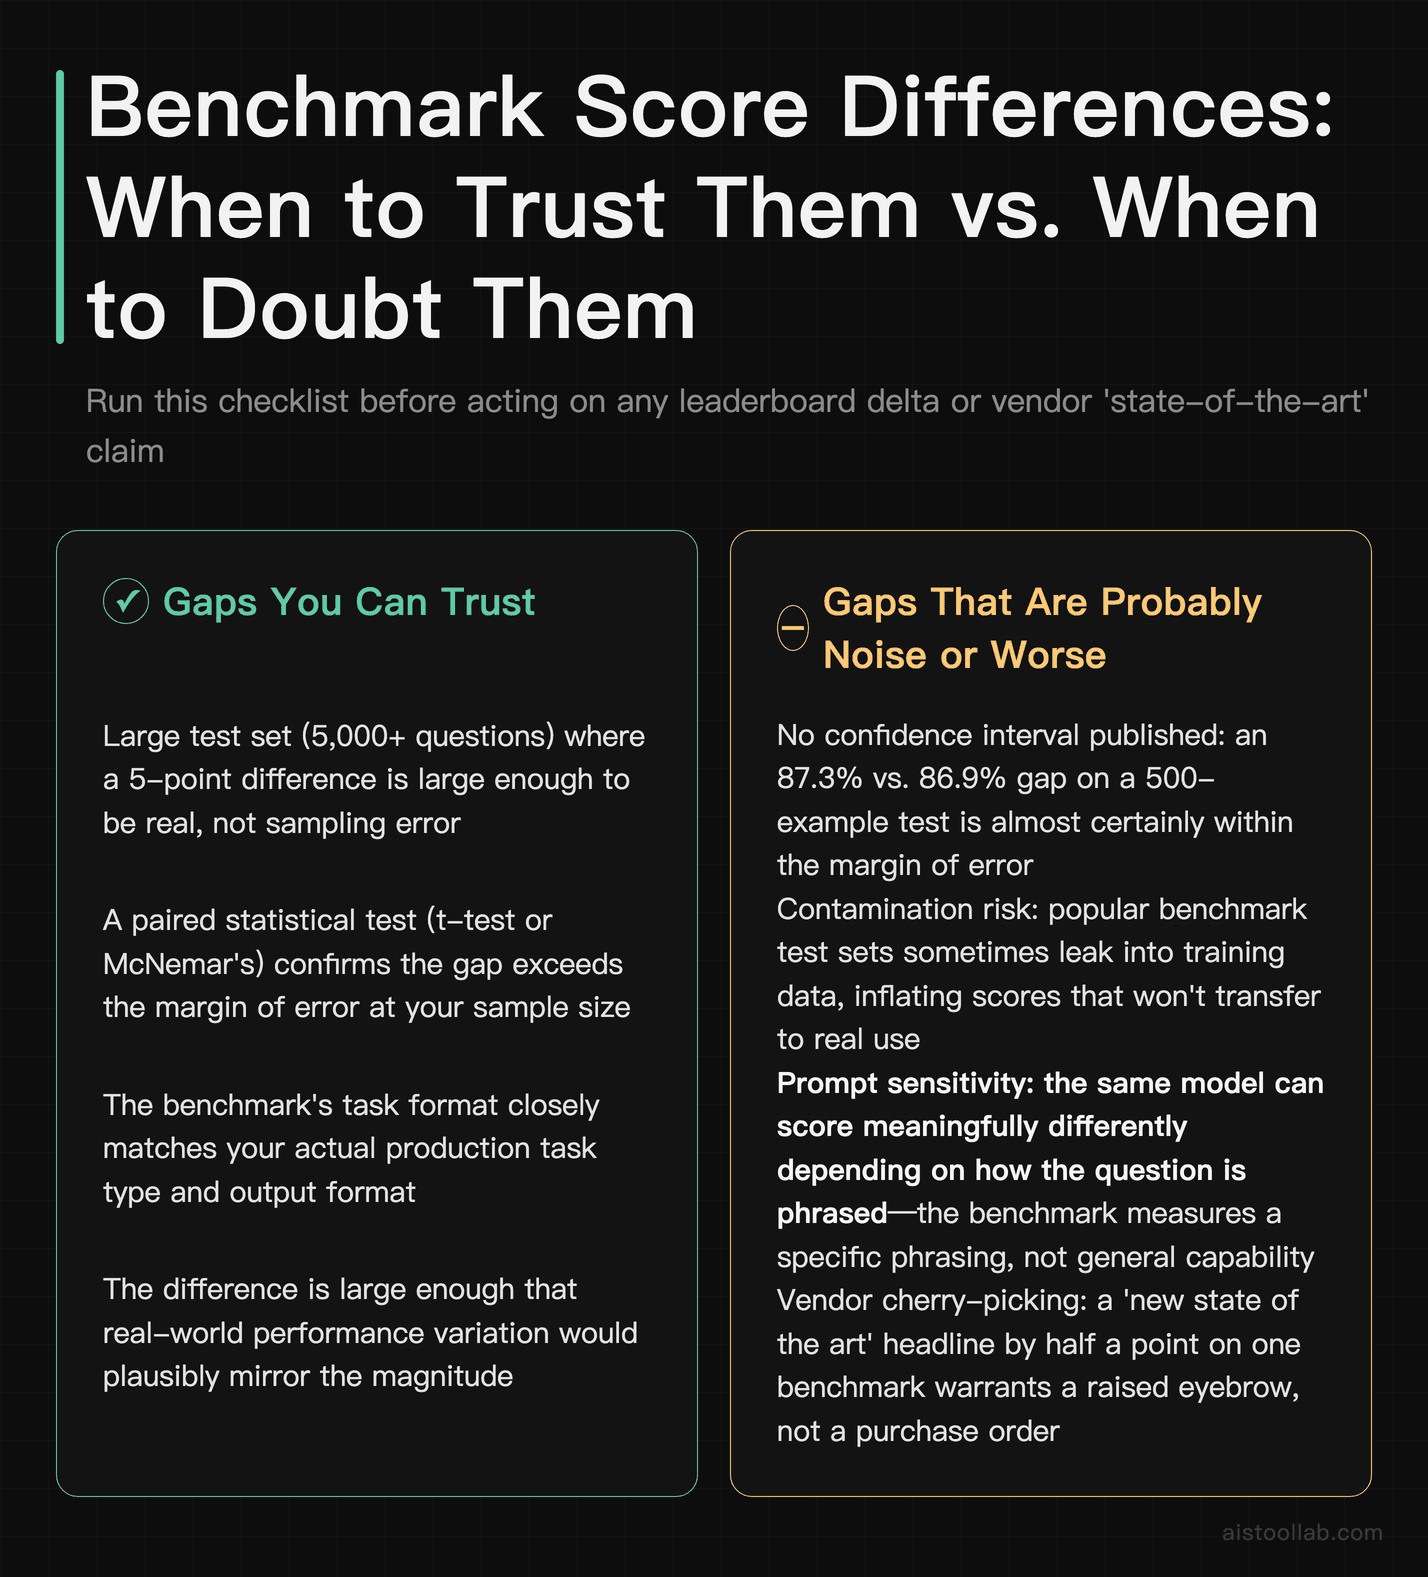
A benchmark score without a confidence interval is half a measurement. If Model A scores 87.3% and Model B scores 86.9% on a 500-example test, the difference is almost certainly within the margin of error — meaning you cannot honestly claim A is better. To check, compute whether the difference is statistically significant. For paired comparisons on the same test set, a paired test (like a paired t-test or McNemar’s test for binary outcomes) tells you whether the gap could plausibly be chance.
The rough intuition: smaller test sets produce wider confidence intervals, so small score gaps on small benchmarks mean nothing. A 0.5-point difference on a 200-question eval is noise. A 5-point difference on a 5,000-question eval is probably real. When a vendor blog trumpets a “new state of the art” by half a point, your default reaction should be a raised eyebrow, not a purchase order.
Other ways benchmarks mislead: contamination (the test data leaked into training, inflating scores), prompt sensitivity (the same model scores differently depending on phrasing), and cherry-picked subsets (reporting only the benchmarks where a model wins). Always ask: same prompts across all models? Same number of examples? Same scoring method? If the methodology isn’t published, treat the number as marketing.
Stage six — watch for silent regression after the model ships
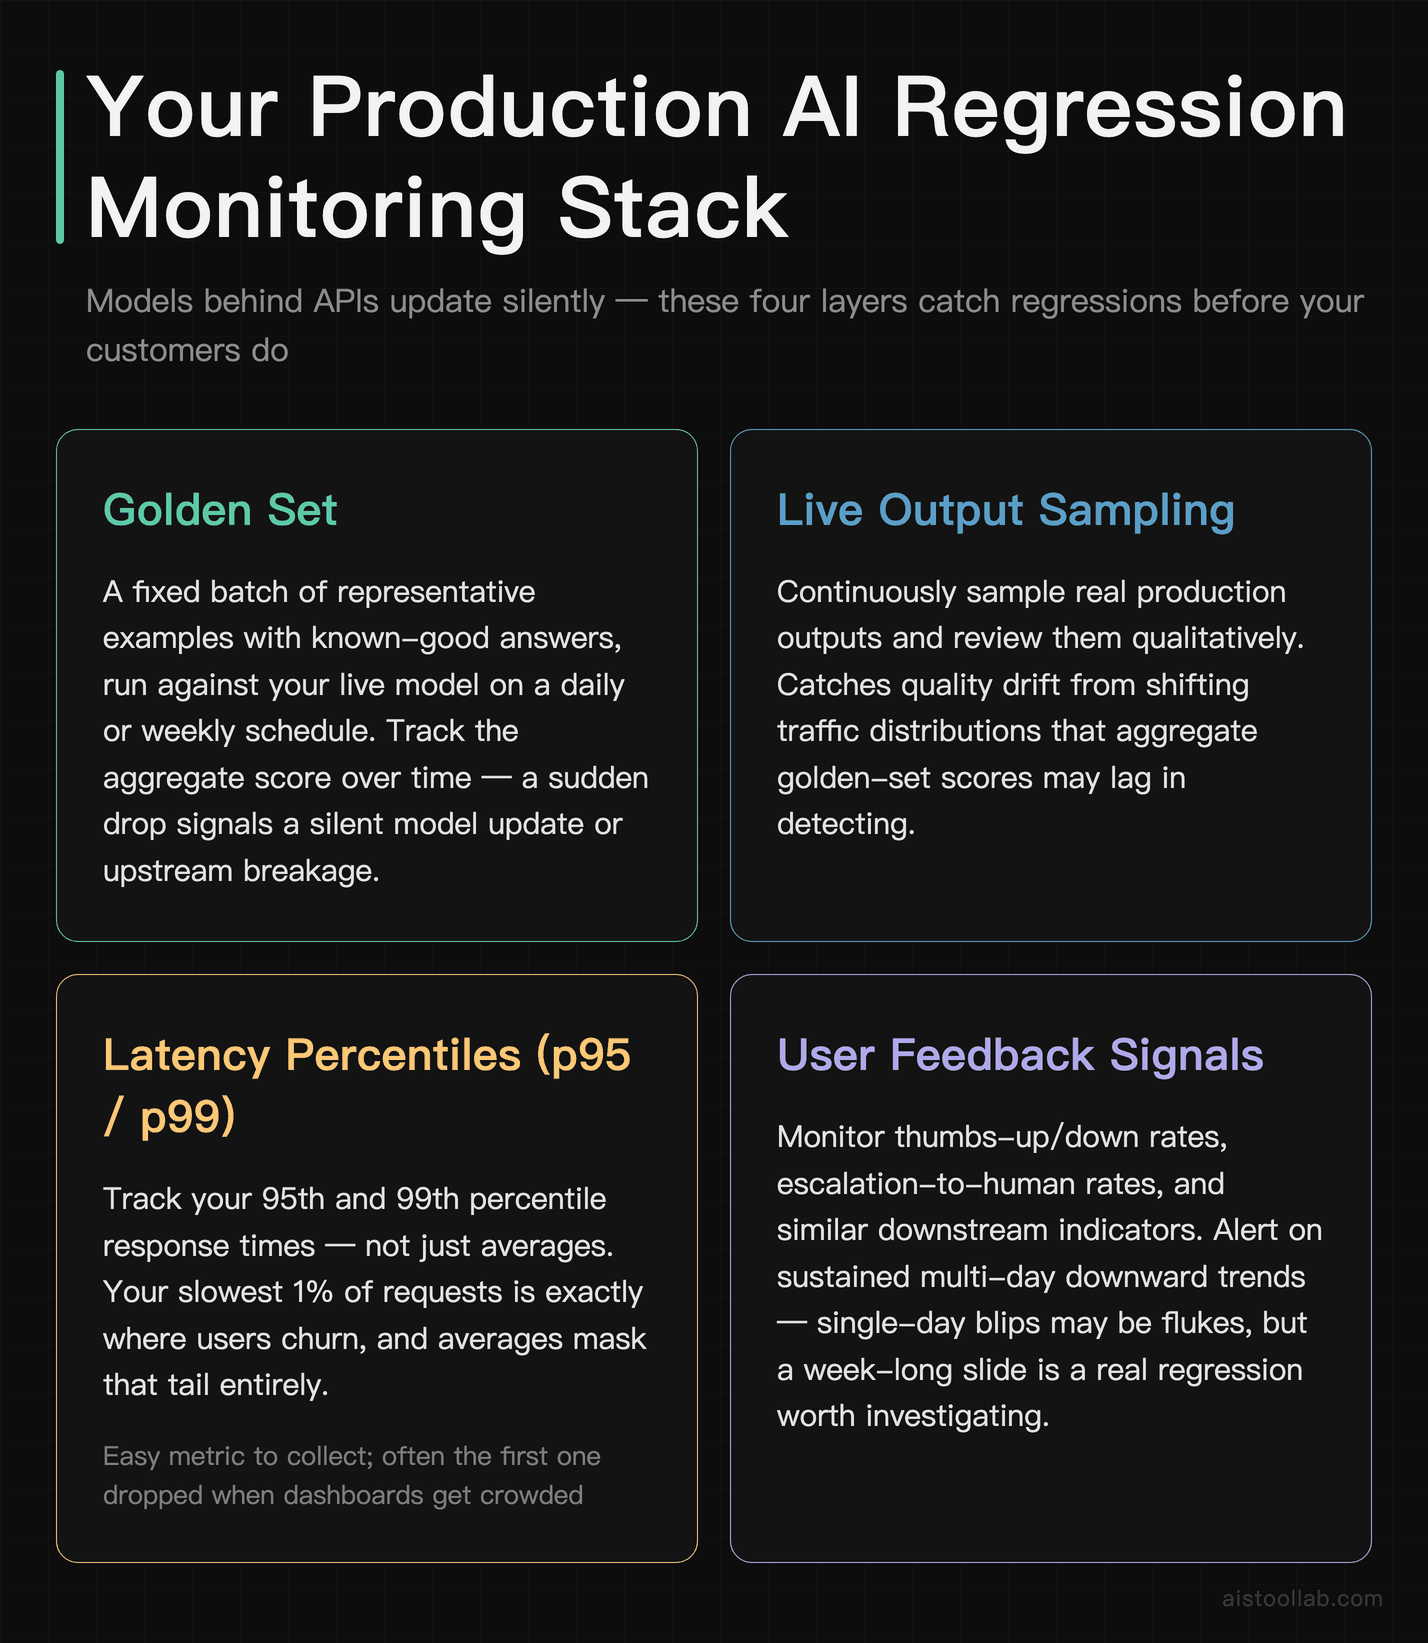
You picked a model. You’re done, right? No. Models behind APIs get updated silently, your traffic distribution shifts, and prompts that worked in January quietly degrade by June. Continuous monitoring is the difference between catching a regression in a dashboard versus catching it in a one-star review.
Set up a small “golden set” — a fixed batch of representative examples with known-good answers — and run it against your live model on a schedule, daily or weekly. Track the aggregate score over time. A sudden drop usually means the underlying model changed or something upstream broke. Pair this with live signals: sample real outputs, track user feedback rates, watch latency percentiles (the p95 and p99, not just the average — your slowest 1% of requests are where users churn).
Alert on meaningful deviations, not noise. A one-day blip might be a fluke; a sustained downward trend over several days is a real regression worth investigating. Treat your eval harness from Step 3 as the engine for all of this — the same code that picked your model keeps it honest in production.
How These Approaches Stack Up
Different evaluation methods suit different stages and budgets. Here’s how the main approaches compare across the dimensions that matter when you’re deciding how much rigor to invest:
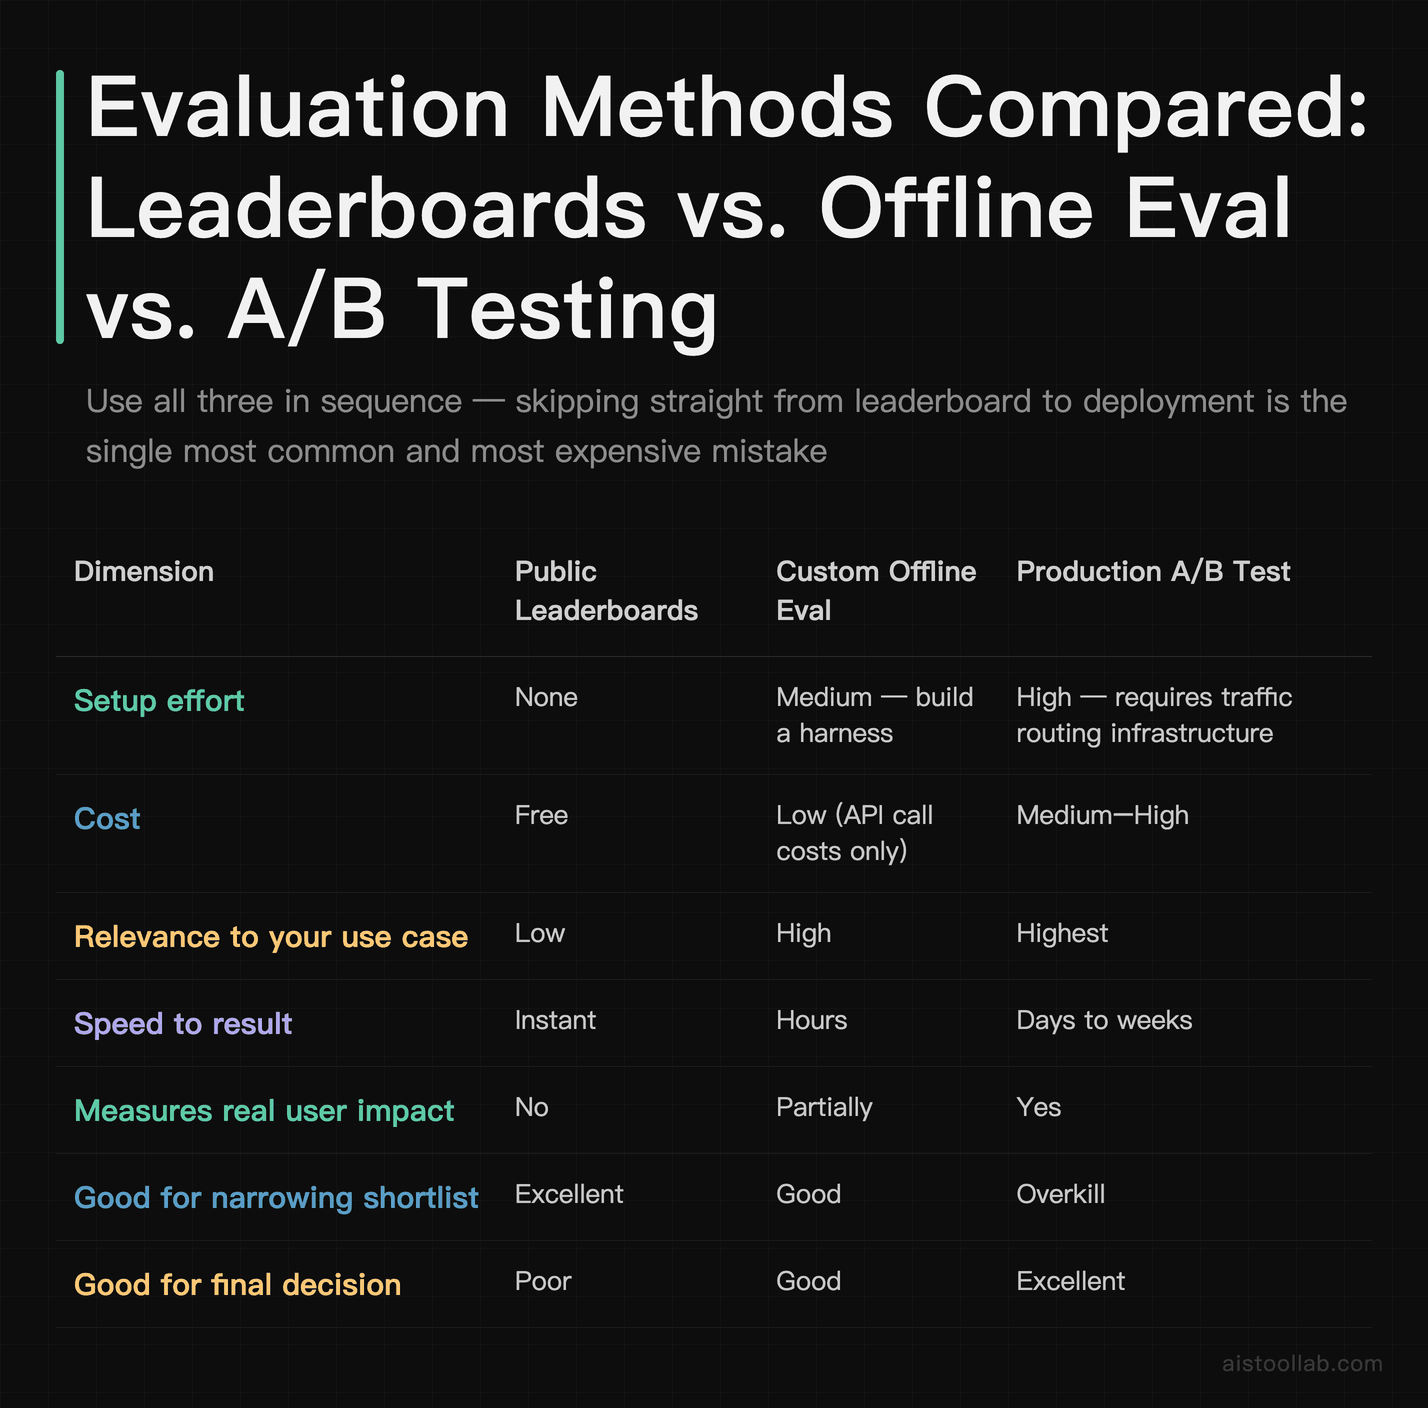
The takeaway: use all three in sequence. Leaderboards to shortlist, offline eval to compare candidates fairly, A/B testing to confirm the winner where the stakes justify it. Skipping straight from leaderboard to deployment is the single most common — and most expensive — mistake.
Who Needs This, and How Deep to Go
The solo developer shipping a side project
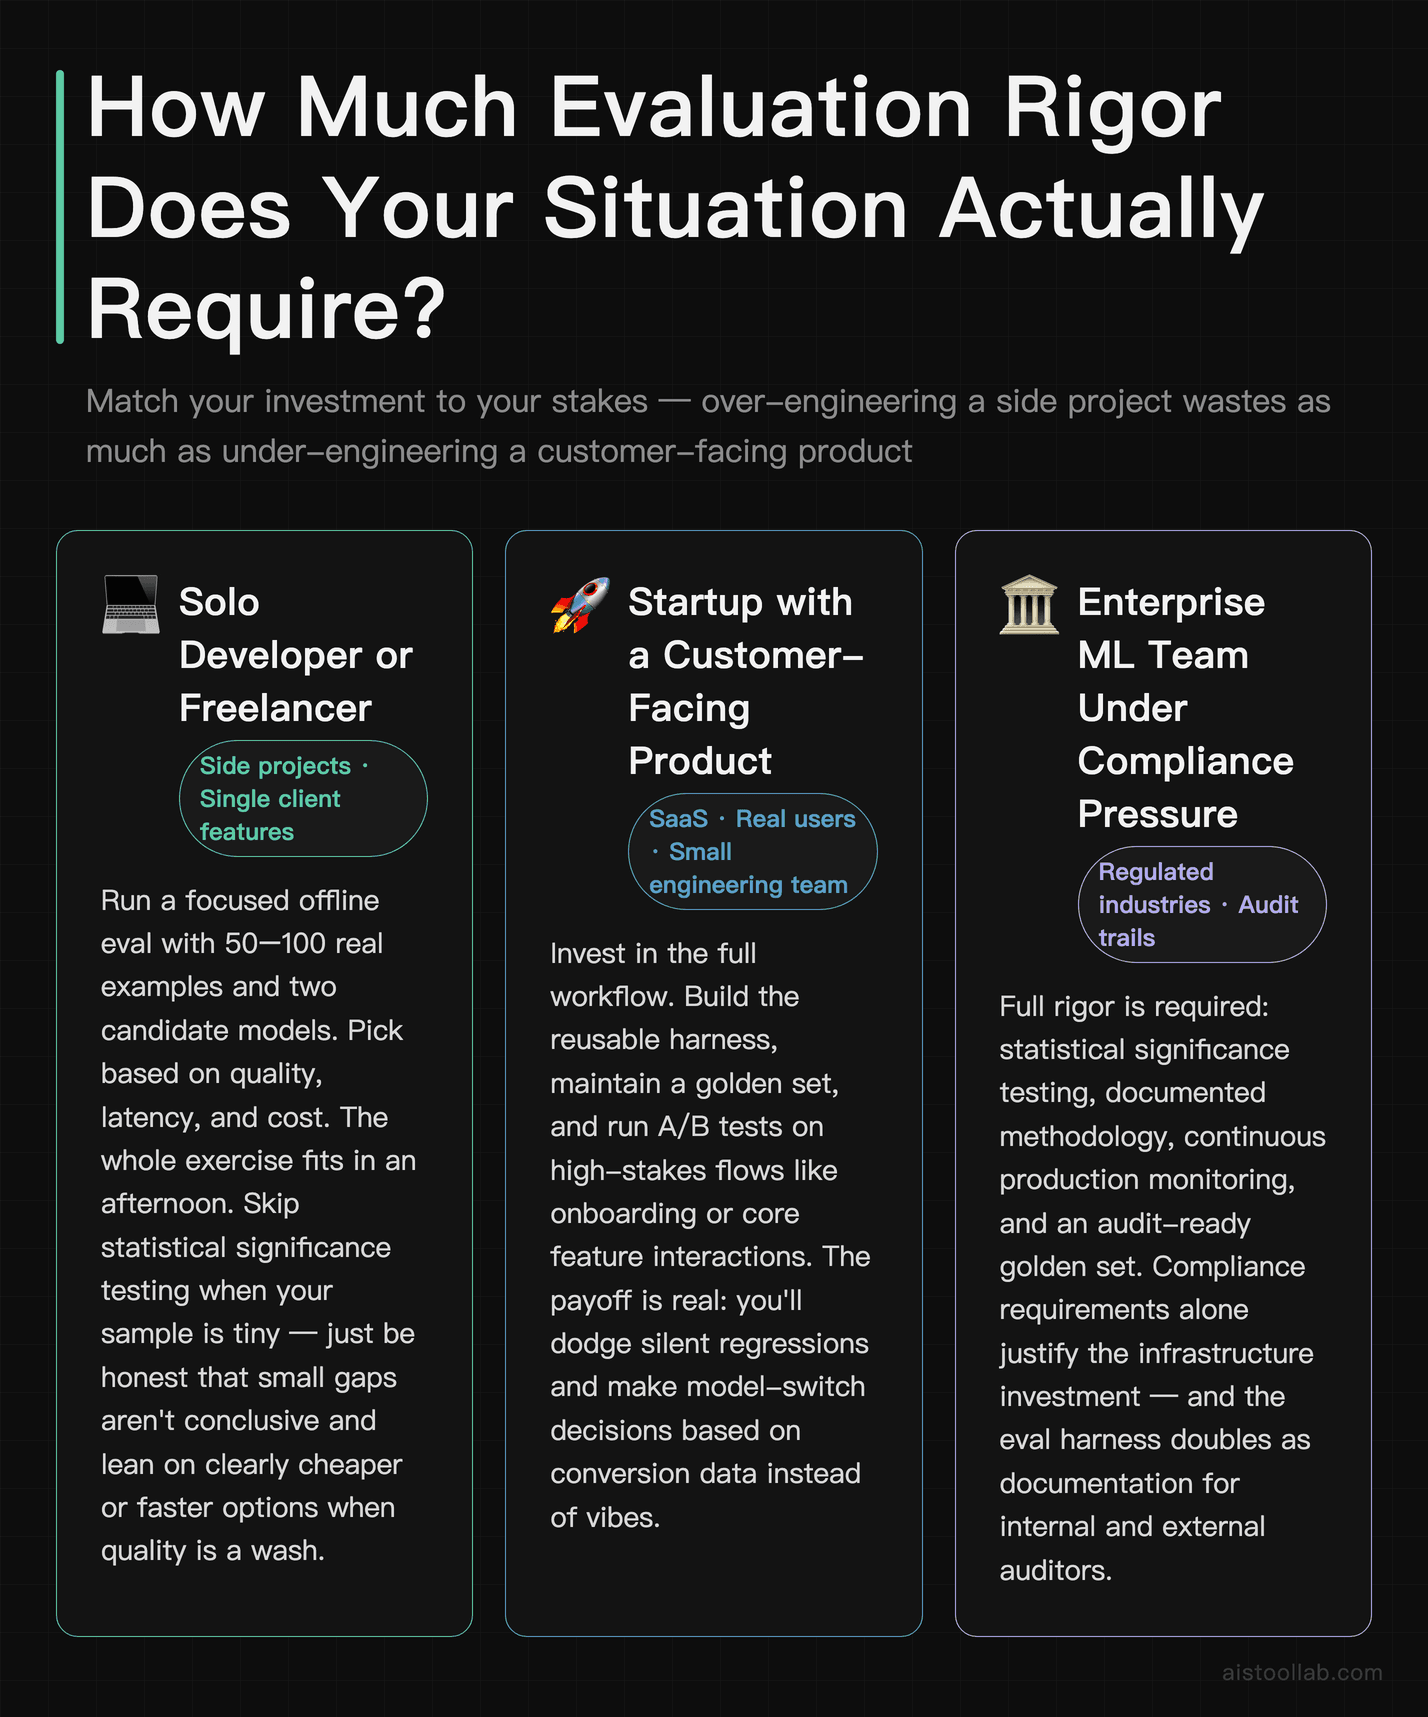
A freelance developer building a single AI feature for a client doesn’t need a full A/B testing pipeline. Run a focused offline eval — 50 to 100 real examples, two candidate models, simple scoring — and pick based on quality, latency, and cost. The whole exercise fits in an afternoon and saves you from a model swap mid-project. Skip statistical significance testing if your sample is tiny; just be honest that small gaps aren’t conclusive and lean on the model that’s clearly cheaper or faster when quality is a wash.
The startup with a customer-facing product
A SaaS startup with real users and a small engineering team should invest in the full workflow. Build the reusable harness, maintain a golden set, and run A/B tests on high-stakes flows like onboarding or core feature interactions. The payoff is real: you’ll dodge silent regressions and make model-switch decisions based on conversion data instead of vibes. This is also where understanding the Best Large Language Models Ranked by Performance Metrics in 2026 shortlist pays off — start from a ranked list, then validate on your data.
The enterprise ML team under compliance pressure
For a larger team where model decisions face audit and the cost of a bad output is high, this entire process becomes mandatory documentation. Confidence intervals, A/B results, and continuous monitoring dashboards aren’t nice-to-haves — they’re the evidence trail that justifies your model choice when someone asks why. Here, the statistical rigor in Step 5 is the whole point.
Common Mistakes That Quietly Wreck Evaluations
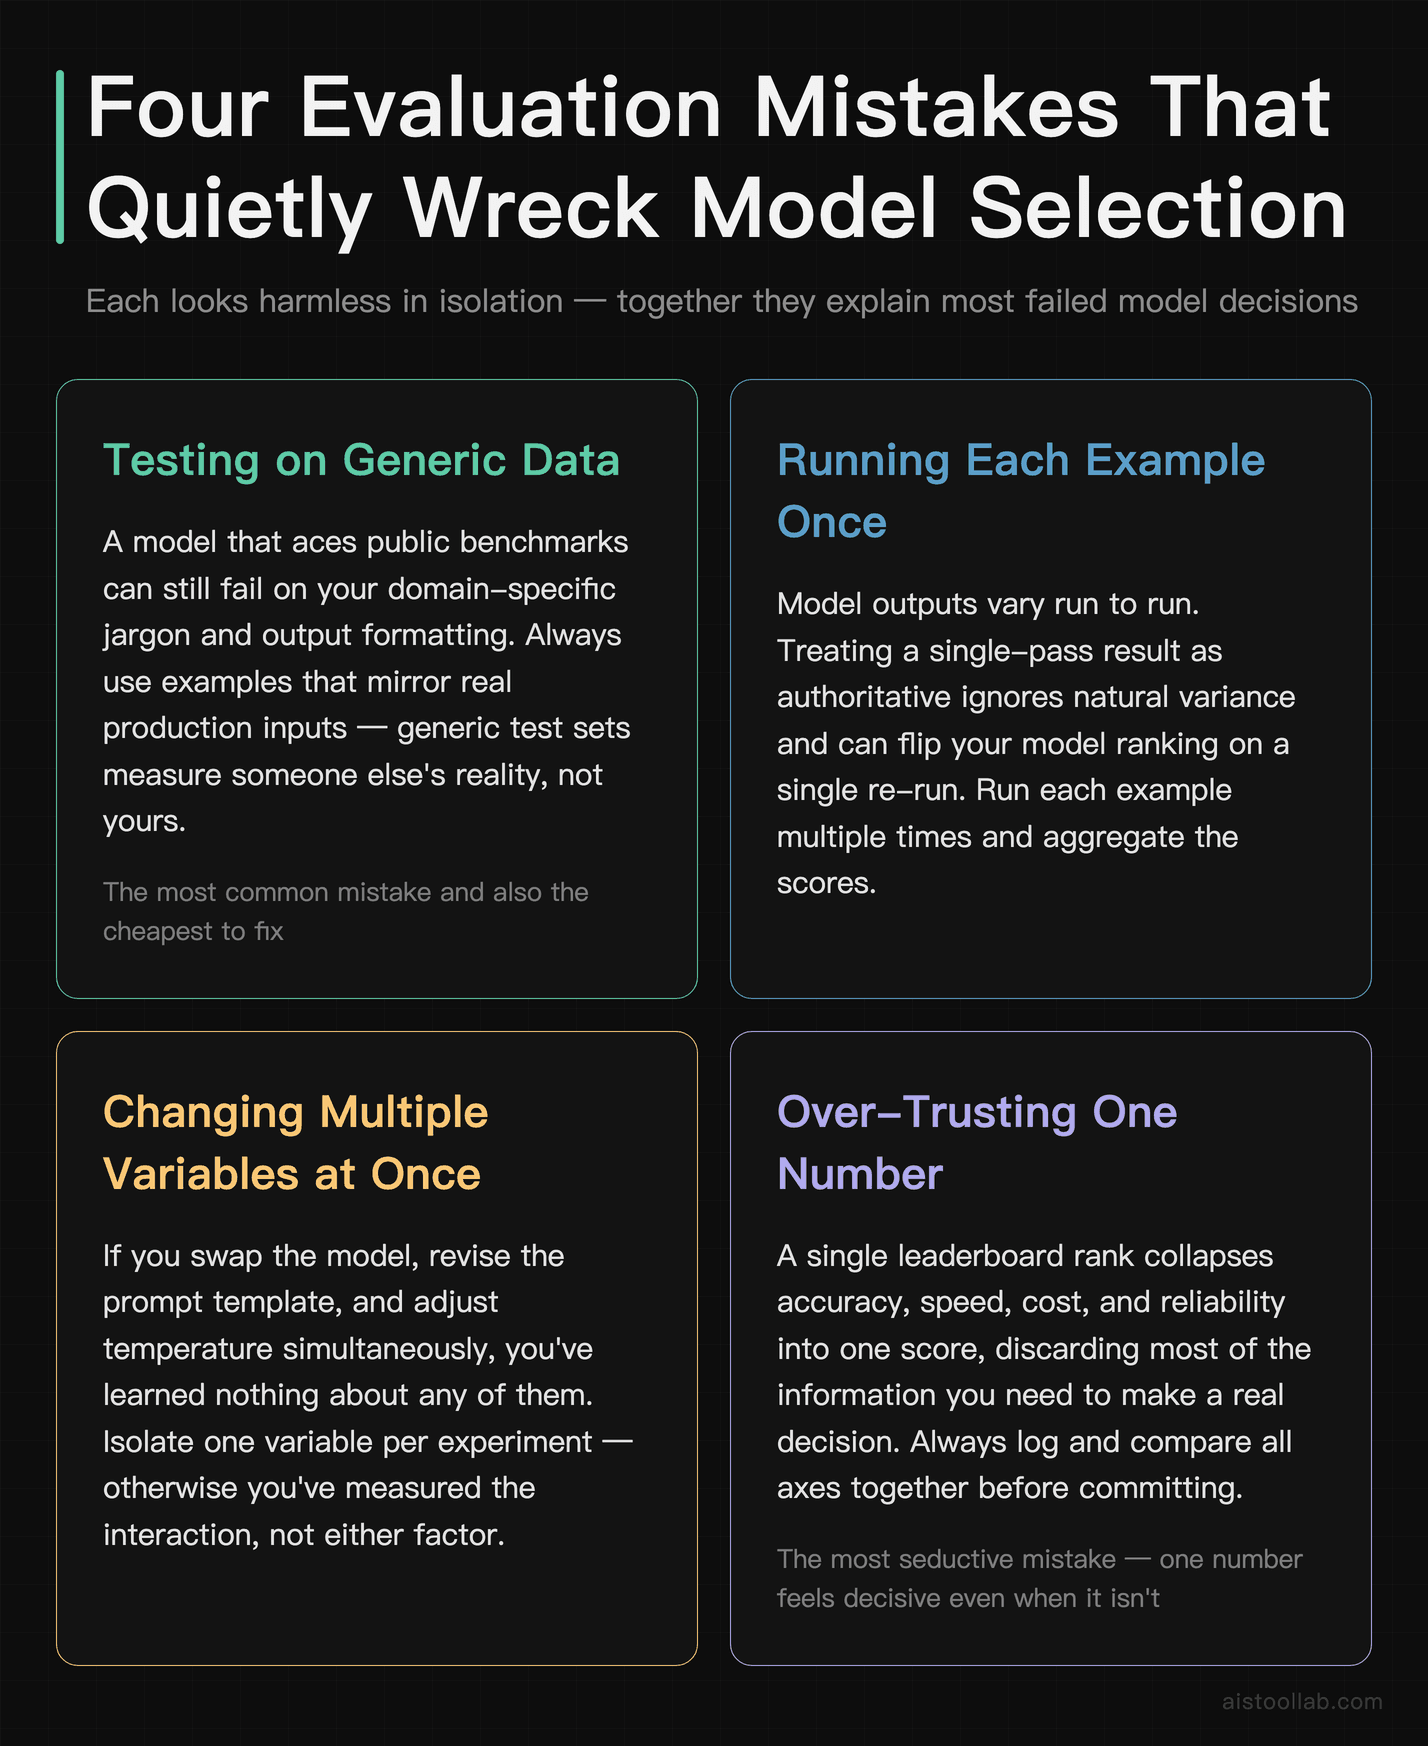
A few patterns sink evaluations more than any single bad metric. The biggest is testing on generic data instead of your own — a model that aces public benchmarks can still flop on your domain-specific jargon or formatting. Second is running each example once and treating the result as gospel, ignoring that model outputs vary run to run. Third is changing multiple variables at once (model plus prompt plus temperature), which makes it impossible to attribute any change.
Then there’s the cardinal sin: comparing models on different conditions. If Model A got a carefully optimized prompt and Model B got a quick draft, you measured prompt engineering, not model quality. And finally, over-trusting a single number. A model is a bundle of tradeoffs across accuracy, speed, cost, and reliability — collapsing that into one leaderboard rank throws away most of the information you actually need.
Frequently Asked Questions
Can I just trust public leaderboards and skip custom evaluation?
You can use them, but you shouldn’t stop there. Public leaderboards like the Open LLM Leaderboard are excellent for one job: narrowing a long list of models down to a shortlist of two or three serious candidates. They tell you which models are broadly capable. What they cannot tell you is which model performs best on your specific data, in your specific format, at your latency budget. Leaderboard test sets are generic by design, and top models now cluster so tightly that the rankings often reflect noise as much as real capability. There’s also the contamination risk — popular benchmarks sometimes leak into training data, inflating scores in ways that don’t transfer to real use. The practical rule: trust leaderboards to shortlist, never to make the final call. Spend an afternoon running your shortlist against a hundred of your own examples and you’ll routinely find the leaderboard winner isn’t your winner. That afternoon is cheap insurance against a model choice you’ll regret in production.
How many test examples do I need for a reliable evaluation?
It depends on how small a difference you need to detect, but some rough guidance helps. For a quick directional read on a side project, 50 to 100 representative examples will surface obvious differences between models. To detect smaller, more subtle gaps with statistical confidence, you generally want several hundred to a few thousand examples, because confidence intervals shrink as your sample grows. The key insight is the relationship between sample size and the gap you’re measuring: a five-point difference is detectable on a small set, but a one-point difference might require thousands of examples to confirm it isn’t chance. Quality matters more than raw quantity, though — 100 examples that genuinely represent your production traffic beat 1,000 generic ones every time. Prioritize coverage of the edge cases and tricky inputs your model will actually face. And remember to run each example multiple times to account for output variability, which effectively increases your sample without needing more unique cases.
What is LLM-as-judge and can I trust it for scoring?
LLM-as-judge means using a strong language model to grade the outputs of the models you’re evaluating, typically against a rubric you provide. It’s popular because it scales — you can score thousands of open-ended generations in minutes without human raters, which makes it practical for the kind of continuous evaluation this workflow recommends. The catch is that it carries biases. Judge models tend to favor longer, more verbose, and more confident-sounding answers even when a shorter answer is better, and they can show position bias when comparing two outputs side by side. The fix is validation: before relying on an LLM judge, have humans grade a representative subset and check that the judge’s scores correlate well with human judgment. If they do, you can trust the judge for that task type. If they diverge, refine your rubric or fall back to human rating for the high-stakes calls. Used carefully, LLM-as-judge is a genuinely useful tool — just don’t treat it as infallible.
Why does the same model score differently when I test it twice?
Language models are stochastic by default — they sample from a probability distribution over possible next tokens, so the same prompt can produce different outputs on different runs. The temperature setting controls how much randomness is in play: higher temperature means more variation, while temperature near zero makes outputs more deterministic (though rarely perfectly so, due to factors like floating-point non-determinism and infrastructure-level batching). This is exactly why running each test example only once is a mistake — a single lucky or unlucky generation can skew your conclusion. The fix is to run each example several times and average the scores, which gives you a more stable estimate of the model’s true performance and also reveals how consistent the model is, which is itself valuable information. A model that’s brilliant half the time and useless the other half is often worse for production than one that’s reliably good. For reproducible benchmarking, fix your temperature and other sampling parameters across all candidates so you’re comparing like with like.
How do I know if a benchmark difference is statistically significant?
Run a significance test on the paired results. Because you’re testing the same examples across different models, you want a paired comparison rather than treating the two score sets as independent. For continuous scores, a paired t-test works; for binary correct/incorrect outcomes, McNemar’s test is the standard choice. These tests give you a p-value indicating how likely the observed gap is under the assumption that there’s no real difference — a low p-value (commonly below 0.05) suggests the difference is unlikely to be pure chance. Equally useful is computing confidence intervals around each model’s score: if the intervals overlap heavily, you can’t confidently say one model is better. The practical shortcut, if you’re not running formal tests, is to be skeptical of small gaps on small test sets. A half-point difference on 200 examples is noise; a multi-point difference on thousands of examples is probably real. When a vendor claims a new record by a fraction of a point, assume it’s within the margin of error until proven otherwise.
Should I optimize for accuracy or latency?
Neither in isolation — it depends entirely on your workload, and pretending there’s a universal answer is how people pick the wrong model. For interactive applications where a user is actively waiting, like chatbots, search, or coding assistants, latency often dominates. A model that’s marginally more accurate but noticeably slower will feel broken to users, and perceived responsiveness frequently drives satisfaction more than a small quality bump. For these, prioritize time-to-first-token and streaming speed, and watch your p95 and p99 latencies, not just the average. For batch or offline workloads — overnight document processing, bulk classification, report generation — latency barely matters, so you can freely choose a slower, smarter, or cheaper model and optimize for throughput and cost per result instead. The right move is to write down your priority order before measuring: define your hard latency ceiling, then maximize quality within it, then minimize cost. Treating accuracy and latency as a single tradeoff with one correct answer is the mistake; treating them as constraints you balance for your specific case is the professional approach.
How often should I re-evaluate a model I’m already using in production?
Continuously, at a low level, with deeper reviews on a schedule. Models behind APIs can change without notice, your traffic distribution drifts over time, and prompts that worked at launch can quietly degrade. The lightweight ongoing approach is a golden set — a fixed batch of representative examples with known-good answers — that you run against your live model daily or weekly and track over time. A sustained drop in that aggregate score signals a regression worth investigating. Layer live signals on top: sample real outputs periodically, monitor user feedback rates and escalation rates, and watch latency percentiles for slowdowns. Beyond the automated monitoring, do a deeper re-evaluation whenever a major new model version ships, when you notice user complaints trending up, or at least quarterly as a hygiene practice. The goal is to catch problems in your dashboard rather than in customer reviews. Because you already built the evaluation harness to choose the model, re-running it is cheap — the infrastructure pays for itself the first time it catches a silent regression.
What’s the difference between batch and streaming inference, and why does it matter for evaluation?
Streaming inference returns the model’s output token by token as it’s generated, so the user starts seeing a response almost immediately — this is what makes chat interfaces feel responsive. Batch inference processes many requests together and returns complete results, which is more efficient for throughput but means each individual request waits for the full generation. The distinction matters for evaluation because the metrics you care about differ completely. For streaming, time-to-first-token is critical — how fast does the response start? — along with the inter-token latency that determines how smoothly text appears. For batch, you care about total throughput (requests processed per minute) and cost per result, since no one is watching any single request complete in real time. If you evaluate a streaming use case purely on total completion time, or a batch use case on time-to-first-token, you’ll optimize for the wrong thing. Match your evaluation metrics to your serving mode. Some inference platforms are dramatically better at one mode than the other, so this choice can influence not just which model you pick but which provider you run it on.
The Honest Bottom Line

If it were my deployment on the line, here’s the sequence I’d run every time: start with leaderboards to build a shortlist of two or three models, then ignore the leaderboard rankings the moment I have my own data. Build a small reusable harness, test on a few hundred real examples with multiple runs each, log quality and latency and cost together, and check whether any gap I find is actually significant rather than noise. For anything customer-facing, confirm with an A/B test on real traffic. Then keep a golden set running in production forever.
The whole philosophy fits in one sentence: benchmarks predict capability, but only your own data predicts outcomes. The people who get burned are the ones who treat a leaderboard rank as a decision. The people who ship reliable AI features treat it as a starting hypothesis they then go test. Build the harness once, and every future model decision gets faster, cheaper, and far more honest. Your next step is concrete — grab a hundred examples from your real workload and run two models against them this week. You’ll learn more in that one afternoon than from a month of reading leaderboards.
Last updated: 2026
Found this review helpful?
👉 Browse the AI Tools Library to find the right tools for your workflow.