Everyone Benchmarks Latency Wrong — And It’s Costing You
Here’s a claim that gets people fired up on Hacker News: the latency number printed on a model’s marketing page is almost useless for predicting how your app will actually feel. Not “slightly misleading” — genuinely disconnected from production reality. A model can post a gorgeous benchmark figure under ideal lab conditions and then crawl the moment you put it behind a real API, with real users, real context windows, and real concurrency.
The reason is simple but rarely explained well: “latency” isn’t one number. It’s at least three or four different measurements wearing the same coat. Time to first token. Time between tokens. End-to-end completion time. Queue time under load. Vendors quote whichever flatters them, and the open-source crowd quotes whichever they measured on a freshly idle GPU with a batch size of one. Both are technically true. Both will burn you if you plan capacity around them.
So let’s untangle it. This is a compiled breakdown — drawn from official documentation, published benchmark methodology, and the consensus you’ll find across developer reviews on Reddit and HN — of how managed cloud APIs and self-hosted open-weight models actually behave on speed, and more importantly, why the same model can be fast or painfully slow depending on knobs you control. No fabricated millisecond claims; where exact figures aren’t publicly verifiable, I’ll say so and talk in the ranges and patterns that hold up.
Update: this piece talks in terms of categories — a managed cloud API versus a self-hosted open-weight model — rather than specific model versions. The line-up moves on constantly as providers ship newer tiers, but nothing in this piece hinges on a version number. The latency anatomy (TTFT, TPOT, batching, quantization, context-length prefill) and the levers you actually control are identical regardless of which generation you run. Read these categories as stand-ins — “a frontier cloud API” versus “a self-hosted open-weight model” — and apply the same reasoning to whatever’s current when you read this.
The Anatomy of “Latency” Nobody Explains
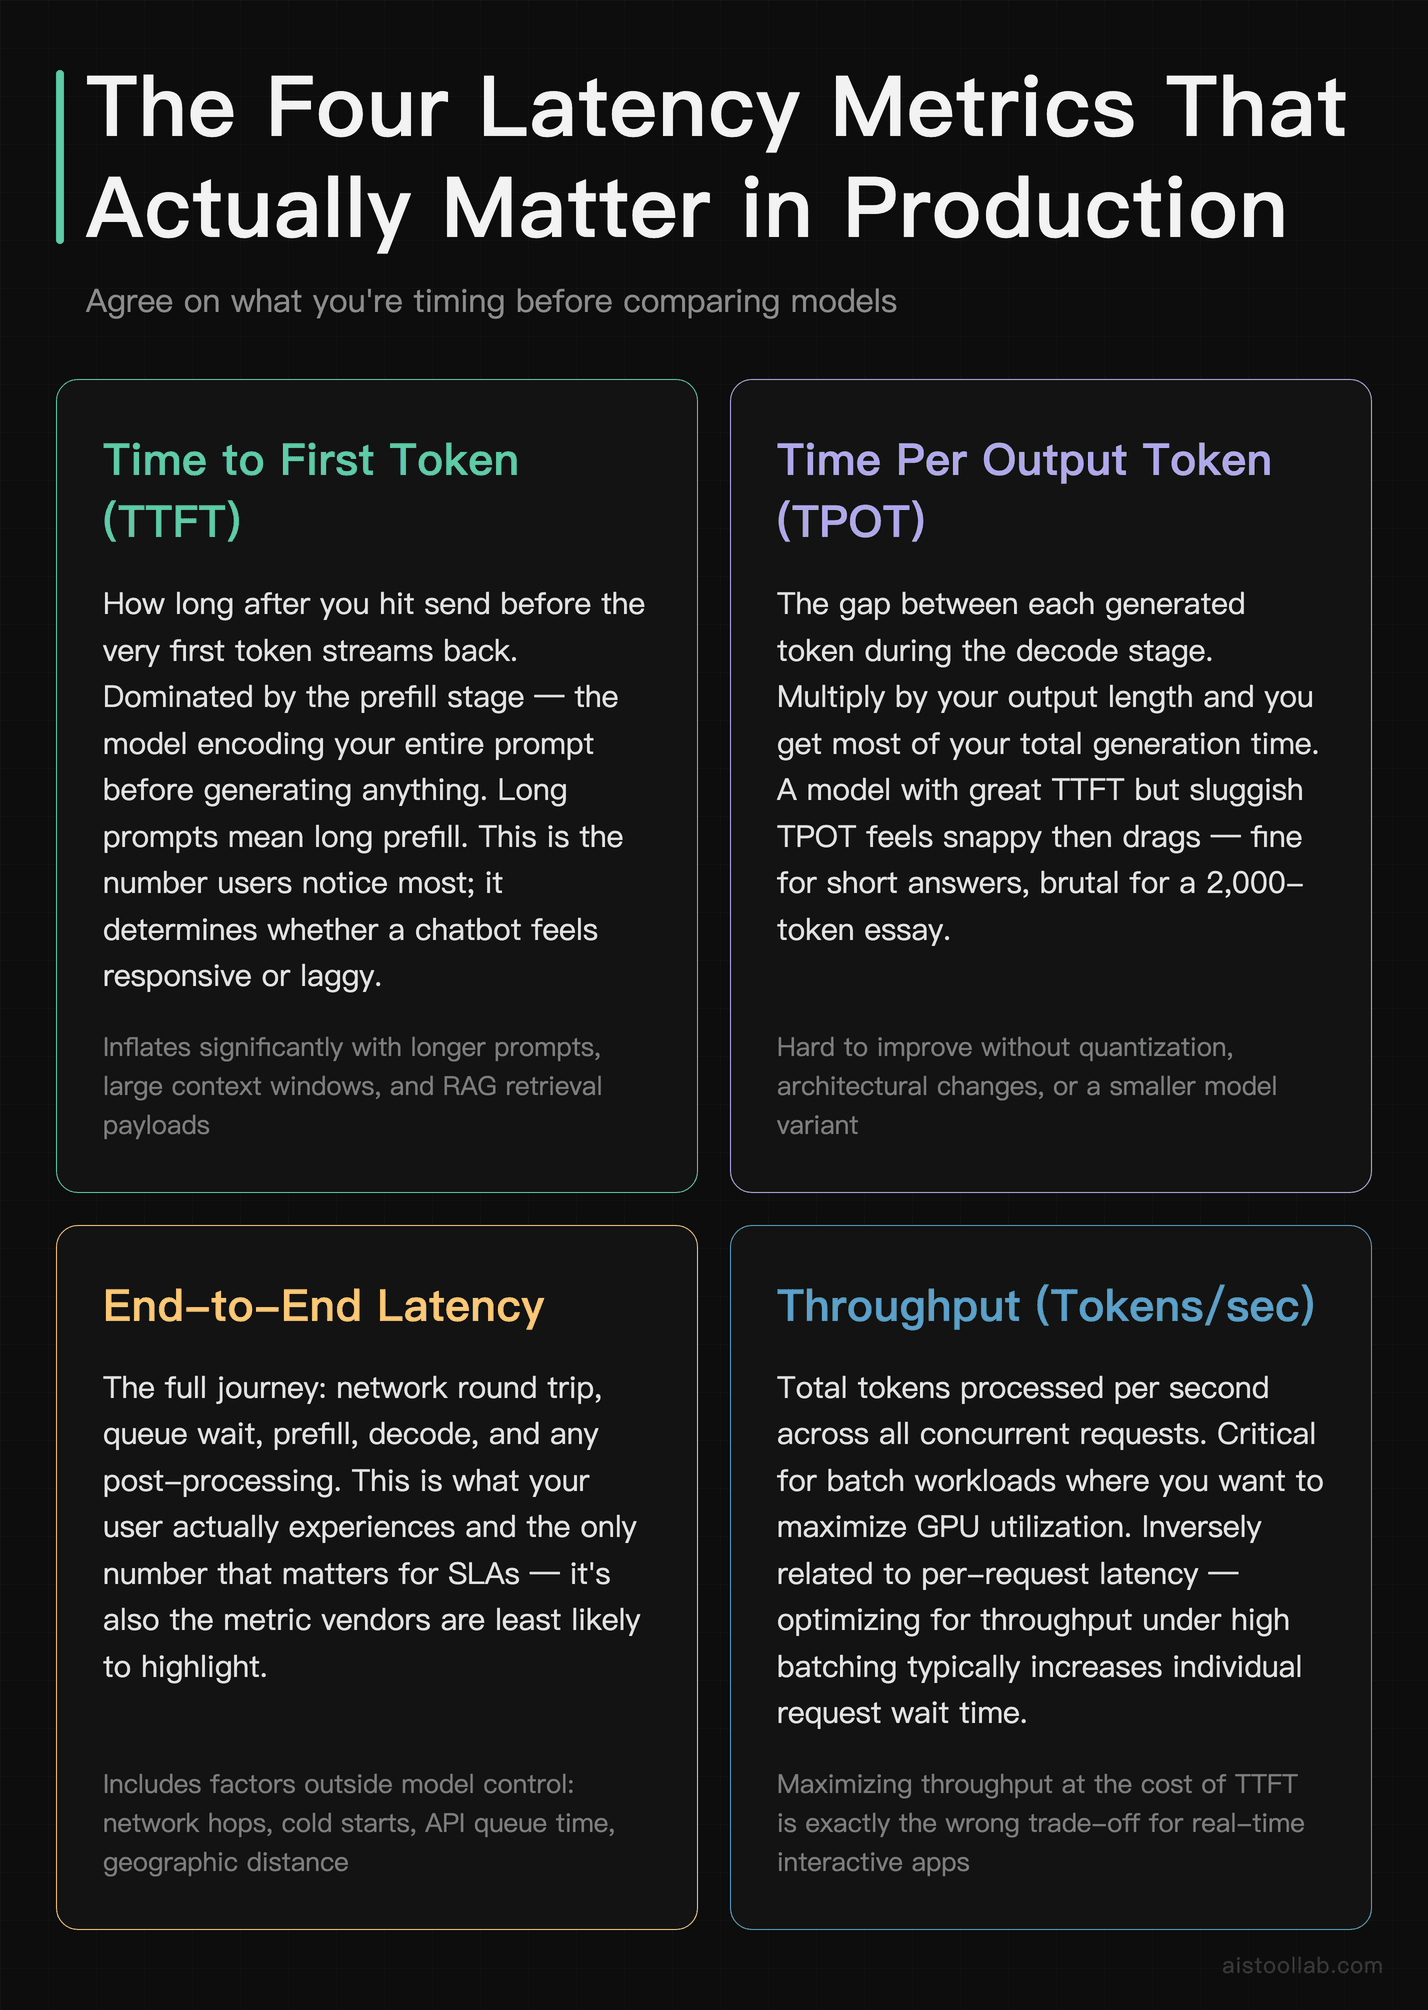
Before you can compare your options, you need to agree on what you’re timing. In production inference, the metrics that matter are distinct enough that optimizing one can hurt another.
Time to First Token (TTFT) is how long after you hit send before the very first token streams back. This is dominated by the prefill stage — the model reading and encoding your entire prompt before it generates anything. Long prompts mean long prefill. This is the number that makes a chatbot feel responsive or laggy, because humans notice the gap before words start appearing more than they notice the streaming speed afterward.
Time Per Output Token (TPOT), sometimes called inter-token latency, is the gap between each generated token during the decode stage. Multiply it by your output length and you get most of your total generation time. A model with a great TTFT but a sluggish TPOT feels snappy then drags — fine for short answers, brutal for a 2,000-token essay.
End-to-end latency is the whole journey: network round trip, queue wait, prefill, decode, and any post-processing. This is what your user actually experiences, and it’s the only number that matters for SLAs.
Throughput (tokens per second across all concurrent requests) is the throughput-vs-latency trade-off’s other half. Serving systems can push throughput way up by batching requests together — but batching adds wait time to individual requests. High throughput and low per-request latency pull in opposite directions, which is exactly why batch size matters so much. I dug into the serving-layer side of this in the AI Model Serving Platforms Compared piece on vLLM, TensorRT, and Ollama, and the short version is: your serving stack can change real latency more than your choice of model.
Benchmark Numbers vs Production Reality
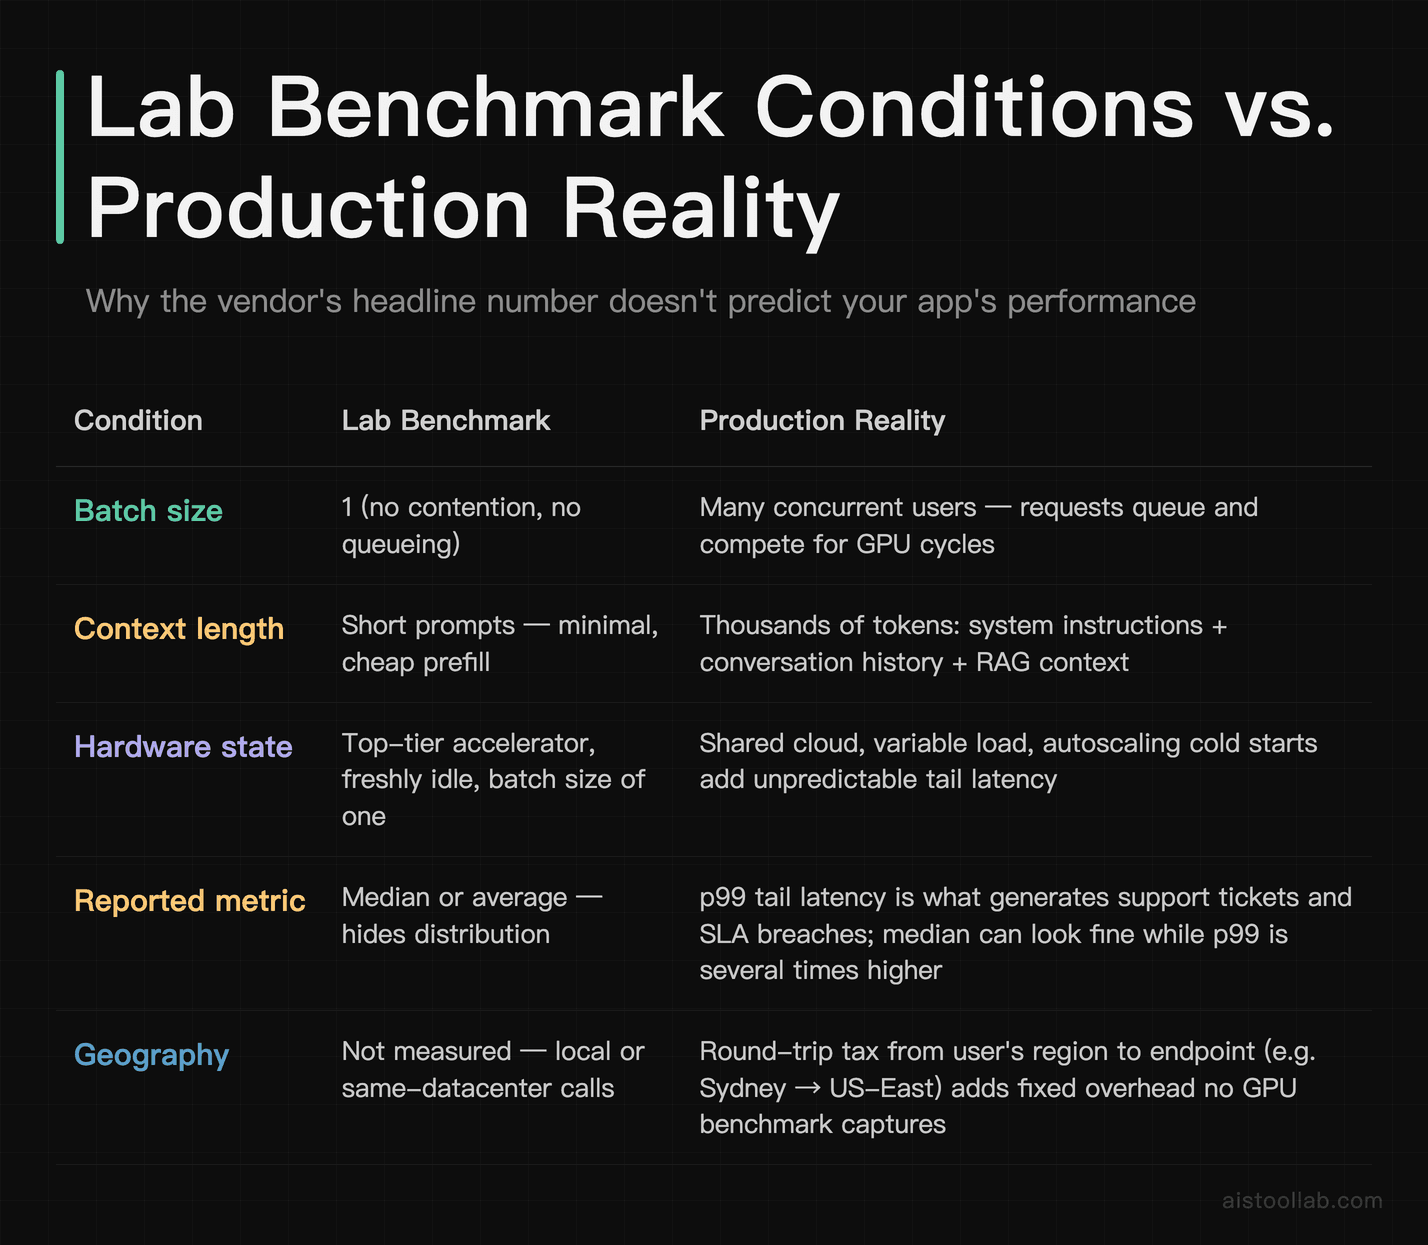
When a lab publishes “X tokens per second,” ask three questions: what batch size, what context length, and what hardware. Those three variables can swing a result by an order of magnitude, and benchmarks almost always pick the flattering combination — batch size one (no contention), short prompts (cheap prefill), and a top-tier accelerator sitting idle.
Production is the opposite world. Your prompts carry system instructions, retrieved context, and conversation history — easily thousands of tokens before the user’s actual question. Concurrent users mean requests queue. Cloud APIs add geographic round-trip time: a request from Sydney to a US-East endpoint pays a tax that no GPU benchmark captures. And rate limits or autoscaling cold starts introduce tail latency that averages hide — your p99 (the slowest 1% of requests) can be several times your median, and p99 is what generates angry support tickets.
The practical takeaway: treat published speed figures as a ceiling, not an estimate. The honest way to compare models is on your prompt shape, your output length, and your concurrency. Synthetic benchmarks rank models; they don’t predict your bill or your user experience. For the broader metric framework here, the AI Model Performance Metrics guide breaks down which numbers to trust for which decision.
How the Options Stack Up
Let me set expectations honestly: I’m not going to invent precise millisecond figures for each model, because publicly verifiable, apples-to-apples latency numbers across every option under identical conditions don’t exist in a form I’d stake the article’s credibility on. What I can do is compare them on the structural factors that determine speed — and those patterns are well documented and widely corroborated by developers.
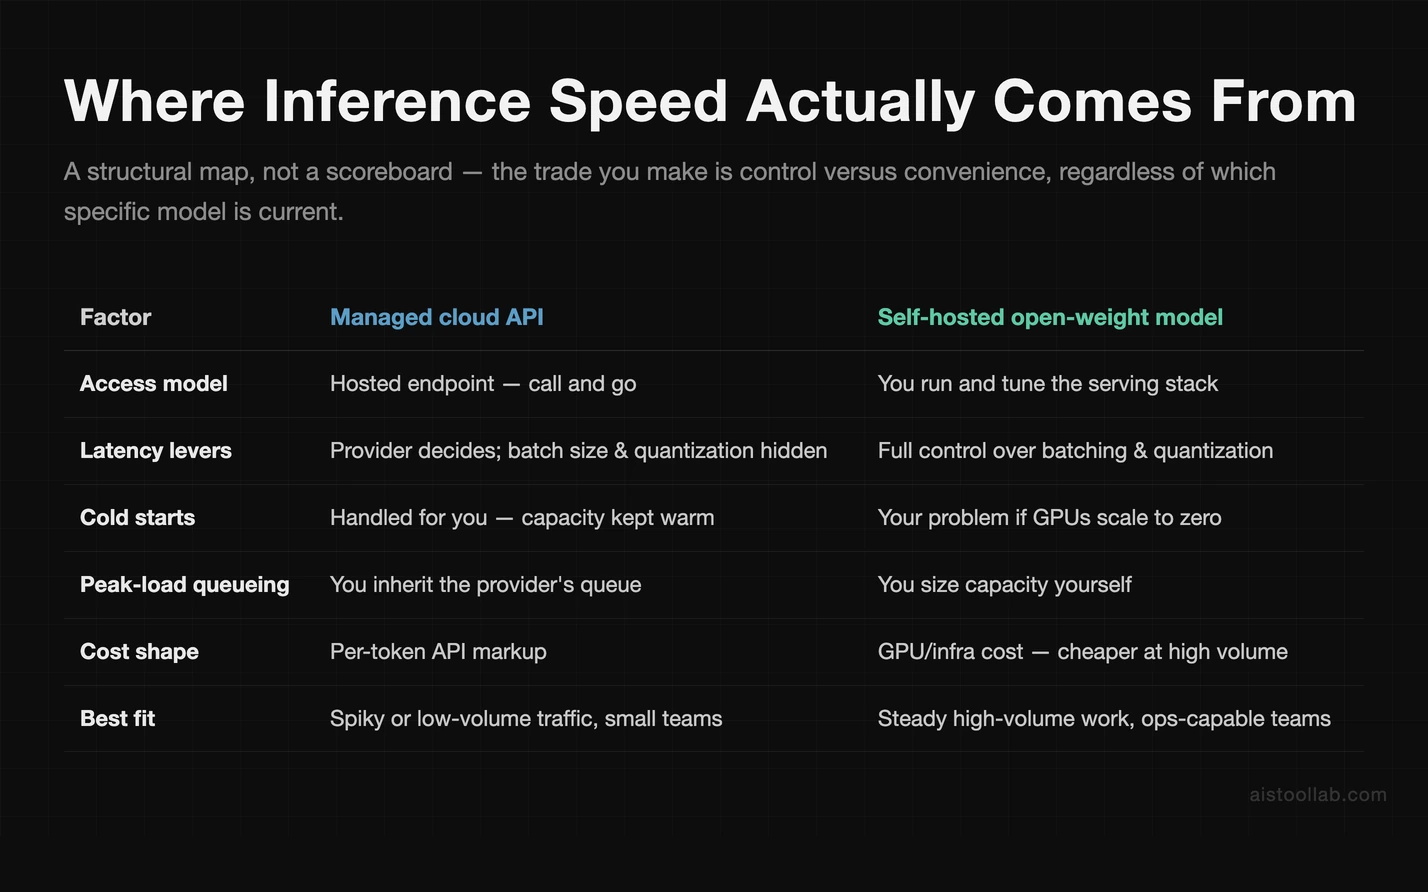
Think of the cloud-versus-self-hosted split as a map of where speed comes from, not a scoreboard. The managed cloud APIs trade control for convenience — you get a maintained, autoscaled endpoint but you can’t touch batch size or quantization, and you inherit whatever queueing the provider has at that moment. A self-hosted open-weight model flips it: more work, but every latency lever is in your hands.
Why Batch Size, Context Length, and Quantization Rule Everything
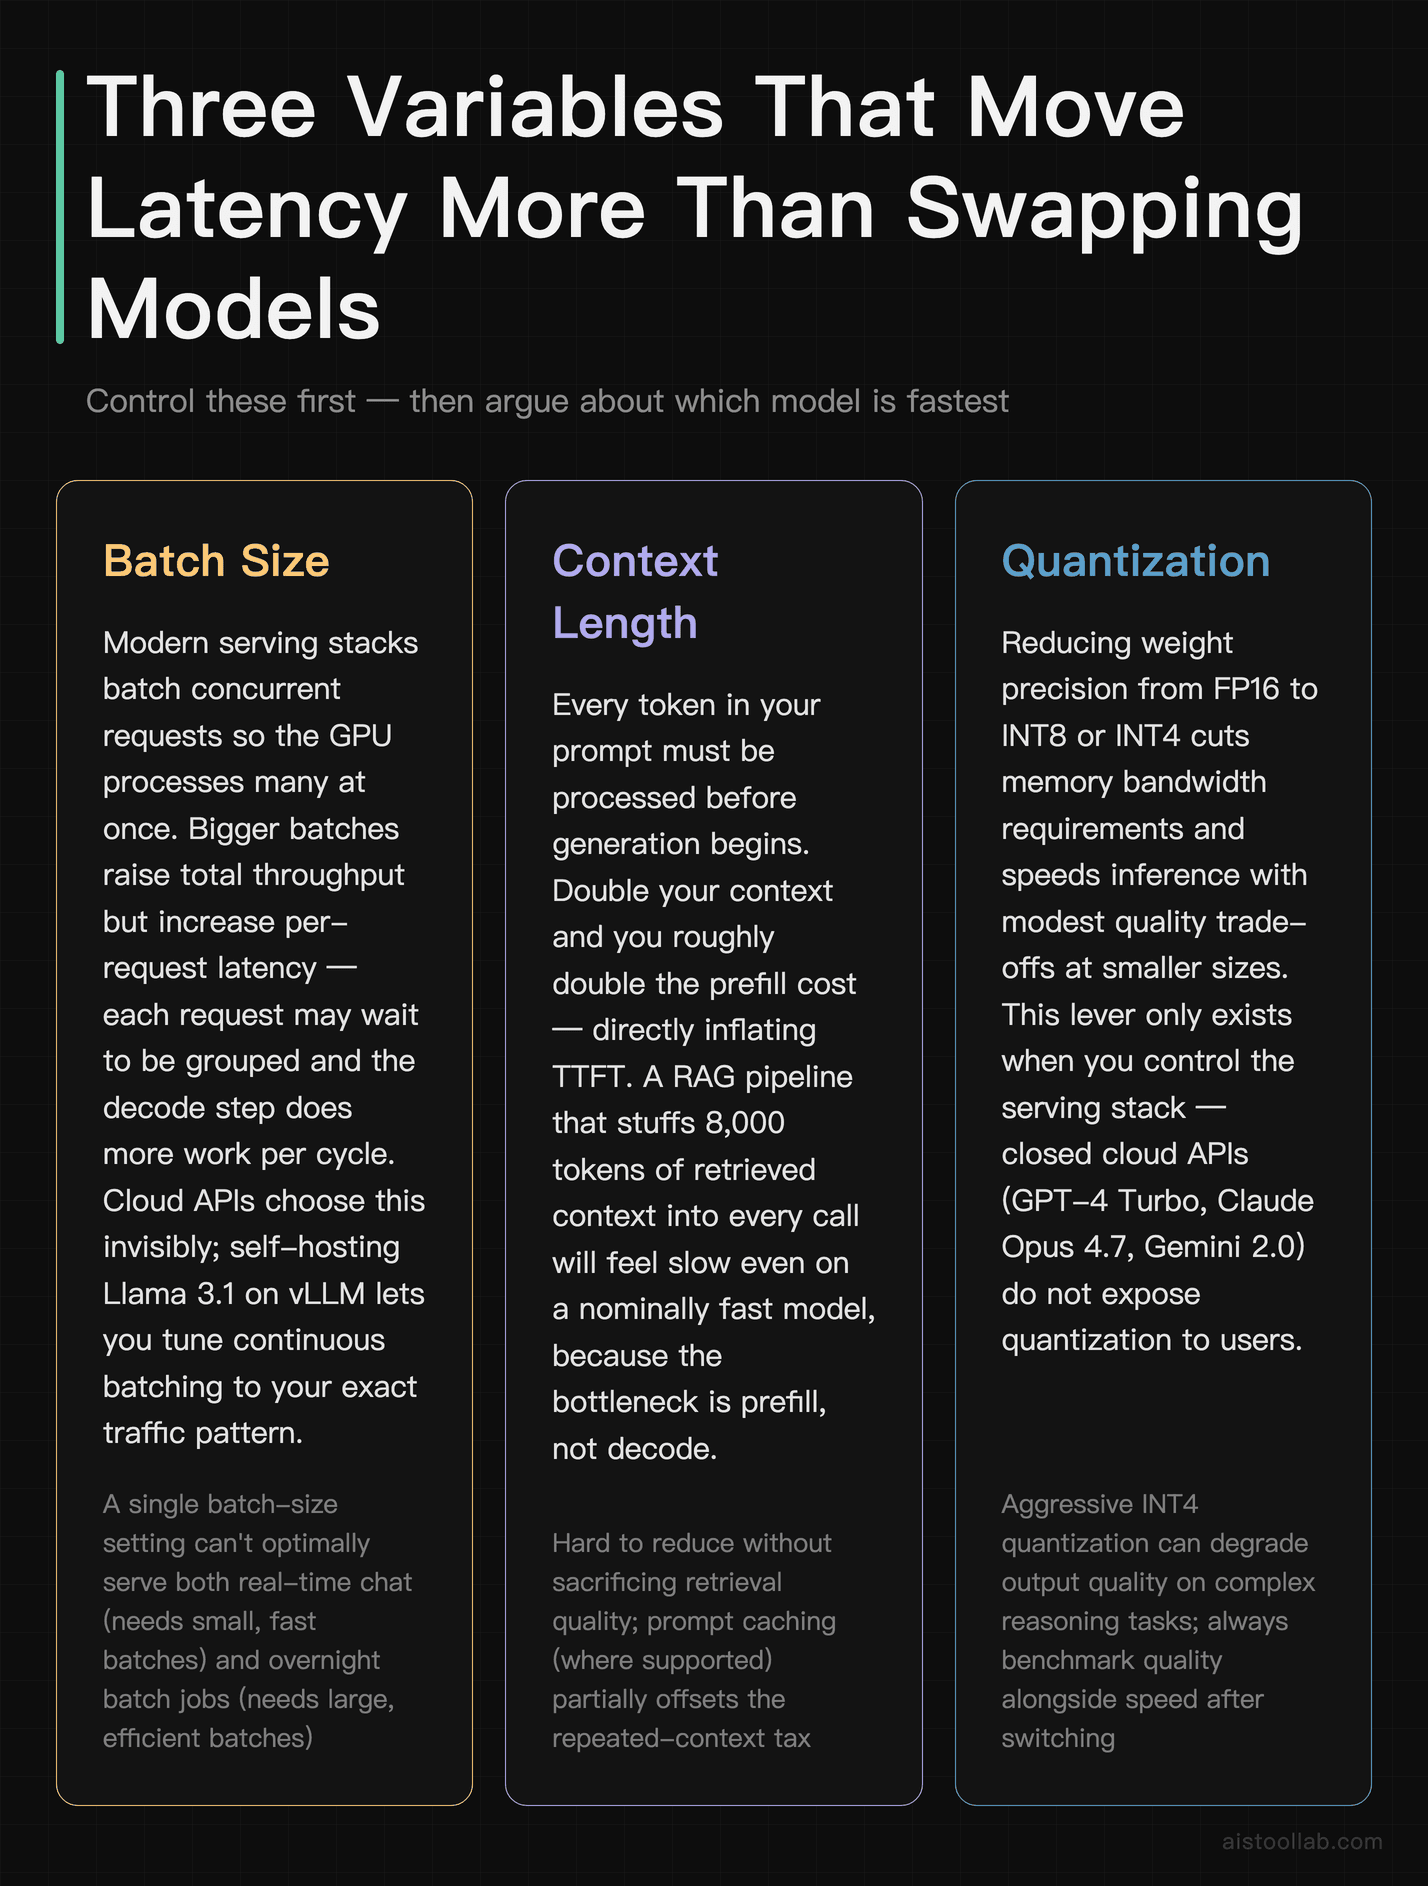
If you remember one section, make it this one. These three factors routinely move real-world latency more than swapping models.
Batch size: the throughput-latency seesaw
Modern serving stacks batch concurrent requests so the GPU processes many at once. Bigger batches mean higher total throughput — more tokens per second across all users — but each individual request may wait to be grouped, and the decode step does more work per cycle. For a real-time chat app, you want small batches and low per-request latency. For an overnight job summarizing 100,000 documents, you want fat batches and maximum throughput, and you genuinely don’t care if any single request takes a few extra seconds. With cloud APIs, the provider picks this for you behind the scenes; self-hosting an open-weight model on something like vLLM lets you tune continuous batching to your exact workload.
Context length: prefill is not free
Every token in your prompt has to be processed before generation starts. Double your context and you roughly increase the prefill cost — which directly inflates TTFT. This is why a RAG pipeline that stuffs 8,000 tokens of retrieved context into every call feels sluggish even on a “fast” model: you’re paying a big prefill tax on every request. Trimming context, caching system prompts (some providers offer prompt caching that dramatically cuts repeat-prefill cost), and being ruthless about what you actually need in the window often beats changing models entirely.
Quantization: speed you can only buy with open weights
Quantization shrinks model weights to lower precision (FP16 down to INT8 or INT4), reducing memory bandwidth pressure and often boosting tokens-per-second meaningfully, at some quality cost. This is a lever only the open-source path gives you. With a self-hosted open-weight model you can run INT4 for a chatbot where slight quality loss is invisible, and FP16 for a task that needs precision. Managed cloud APIs don’t expose this — you get whatever precision the provider serves. That’s the central trade: managed APIs hide complexity but also hide control.
Matching Latency Profiles to Real Use Cases
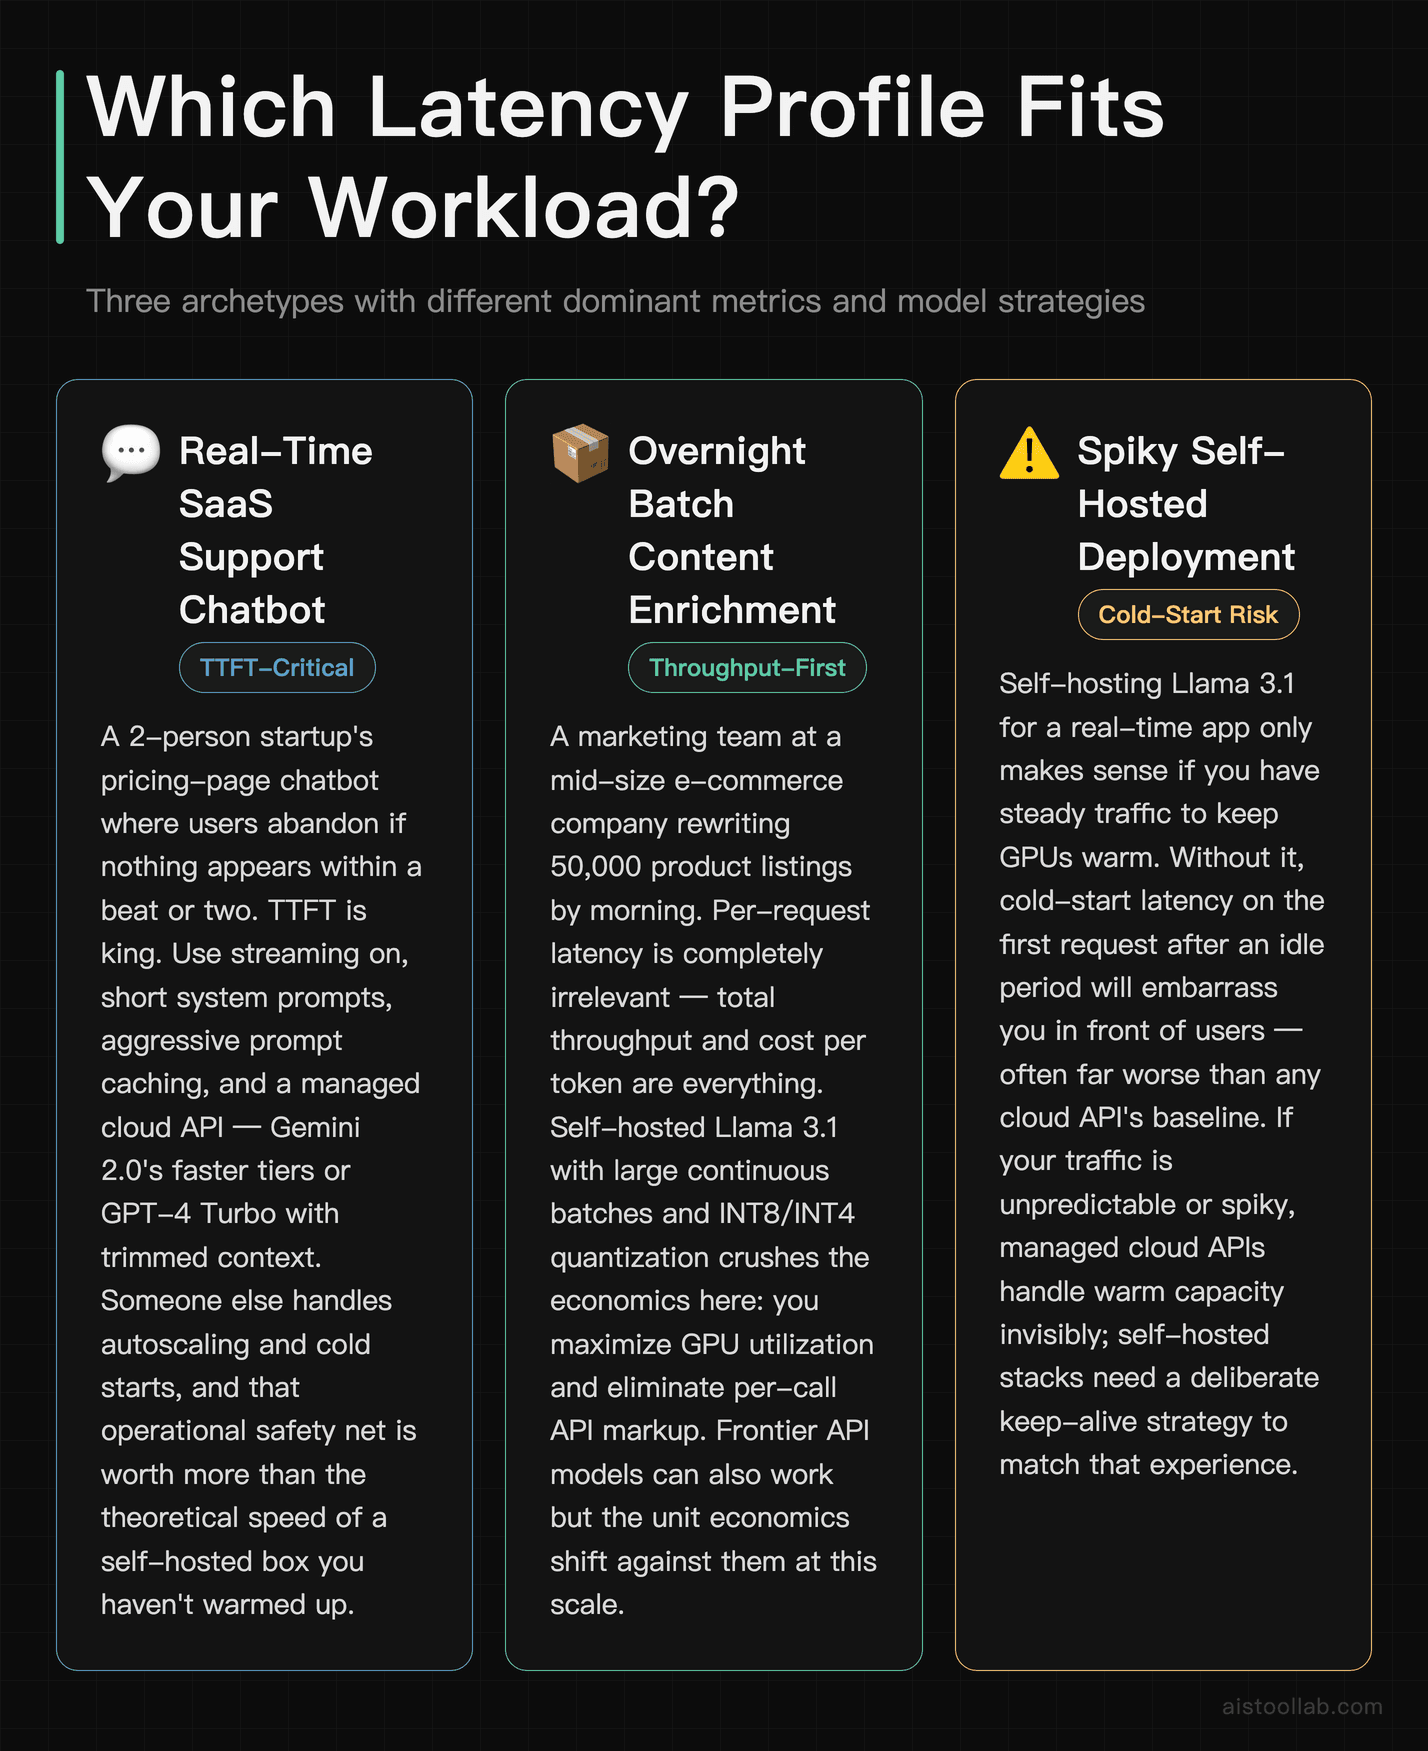
Real-time chat: a customer-support widget on a SaaS site
Picture a 2-person startup running a support chatbot on their pricing page. Here, TTFT is king — users abandon if nothing appears within a beat or two. You want streaming on, short system prompts, aggressive prompt caching, and a model tuned for responsiveness over maximum reasoning depth. A speed-optimized cloud variant (a fast, responsiveness-tuned tier with trimmed context) usually wins because someone else handles autoscaling and cold starts. Self-hosting an open-weight model only makes sense here if you have steady traffic to keep GPUs warm; otherwise cold-start latency on the first request after idle will embarrass you.
Batch processing: a content team enriching 50,000 product listings overnight
A marketing team at a mid-size e-commerce company needs to rewrite tens of thousands of descriptions by morning. Per-request latency is irrelevant — total throughput and cost per token are everything. This is where a self-hosted open-weight model with large continuous batches and INT8/INT4 quantization can crush the economics, because you’re maximizing GPU utilization and not paying per-call API markup. Frontier API models work too, but for high-volume, latency-tolerant work the open-weight route often wins on dollars. Run it overnight, check results with your coffee.
Agentic workflows: a developer building a multi-step research agent
This one’s sneaky. An agent that chains ten tool calls and reasoning steps multiplies latency — a 3-second step run ten times sequentially is a 30-second wait, and users feel every second. Here, raw single-call speed matters less than reducing the number of round trips, parallelizing independent steps, and choosing a model whose reasoning is reliable enough to avoid retries. A strong deep-reasoning model can actually reduce total latency by getting steps right the first time, even if each individual call is heavier. Slower-but-correct beats fast-but-needs-three-tries. If you’re wiring agents into a code editor, the Cursor AI Code Editor Review touches on how latency feels inside a real IDE loop.
The Honest Verdict
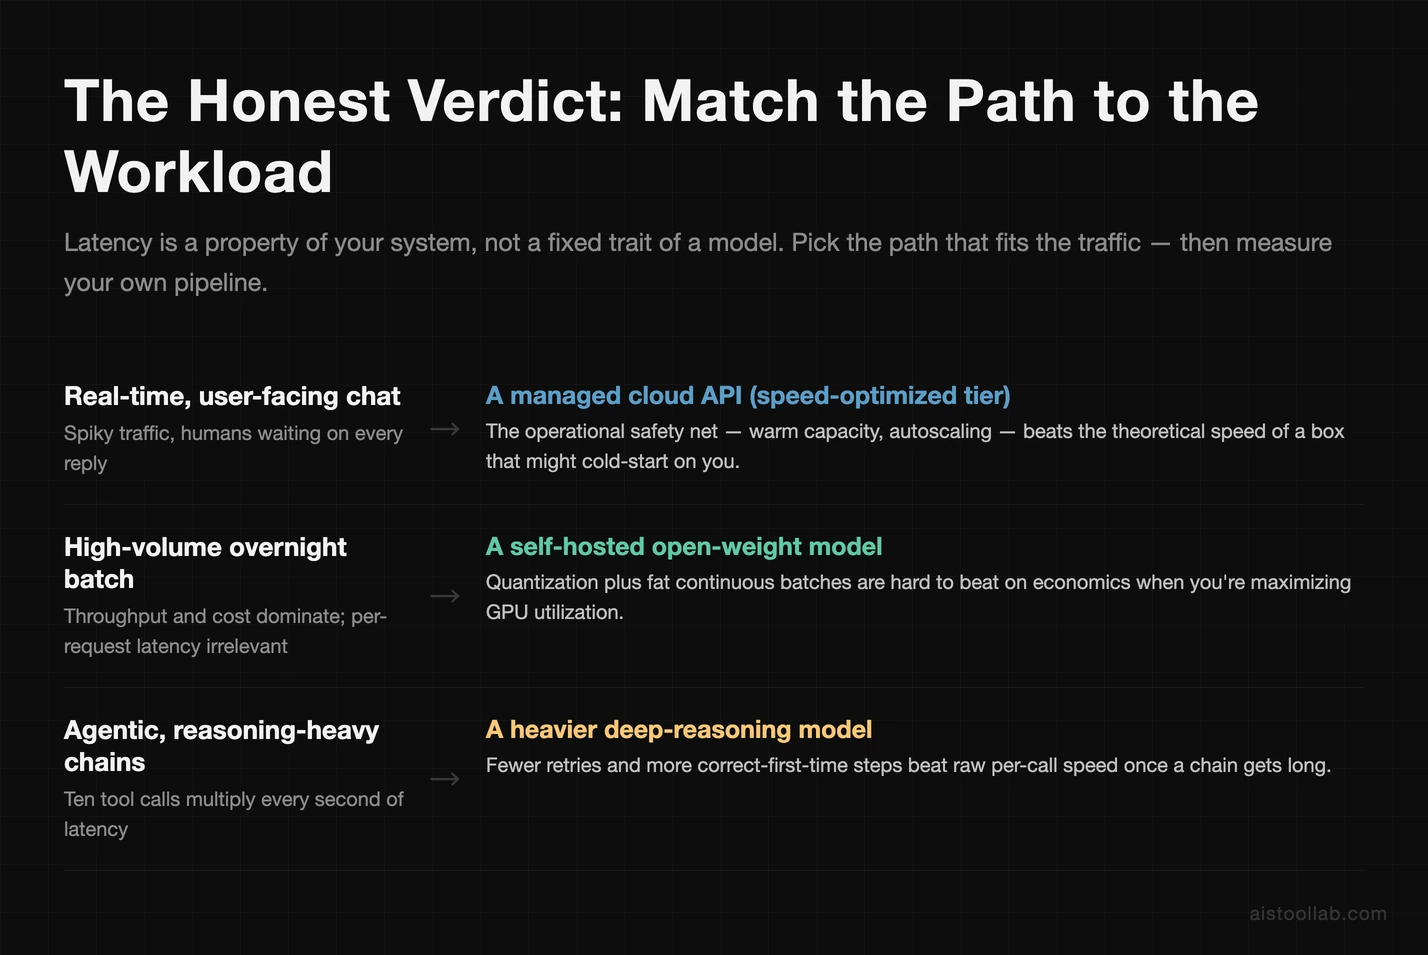
If it were my money and my SLA on the line, here’s how I’d decide. For a latency-sensitive consumer-facing chat product with spiky traffic, I’d lean on a managed cloud API — a fast, responsiveness-tuned tier — because the operational safety net is worth more than the theoretical speed of a self-hosted box that might cold-start on you. For high-volume batch work where cost and throughput dominate and per-request latency doesn’t matter, a self-hosted open-weight model with quantization and fat batches is hard to beat on economics. For agentic, reasoning-heavy workflows, I’d accept a heavier per-call deep-reasoning model if it means fewer retries and more correct-first-time steps, because in a ten-step chain, reliability beats raw speed every time.
But none of that is a substitute for measuring your own workload. The whole point of this breakdown is that latency is a property of your system — prompt shape, batch size, context length, quantization, geography, concurrency — not a fixed trait of a model. The benchmark on a vendor’s page told you almost nothing. Profile your actual pipeline, fix the dominant bottleneck first, and only then argue about which model is “fastest.” For the deeper cost-and-throughput angle, the AI Model Performance Beyond Accuracy piece is the natural next read.
Frequently Asked Questions
What’s the single most important latency metric to track?
It depends on your interface, but for interactive apps the answer is usually Time to First Token (TTFT). Humans perceive responsiveness mostly in that initial gap — the pause between hitting send and seeing the first words appear. If TTFT is good and you’re streaming, users tolerate a slower per-token rate because they’re already reading. For non-interactive batch jobs, flip your priority entirely to throughput (total tokens per second) and ignore per-request latency. The mistake most teams make is tracking a single “average latency” number, which buries the tail. Always monitor p95 and p99 alongside the median, because the slowest 1–5% of requests are what generate complaints, breach SLAs, and make your app feel unreliable even when the average looks fine. A healthy median with an ugly p99 is a common and dangerous pattern under concurrency, and you’ll only catch it if you measure the distribution, not just the mean.
Is a self-hosted open-weight model actually faster than a managed cloud API?
It can be, but “faster” hides a lot. On a well-tuned stack — quantized weights, continuous batching, GPUs sitting physically close to your users — a self-hosted open-weight model can deliver excellent per-request latency and eliminate the network round-trip tax that cloud APIs pay. You also dodge provider-side queueing during peak demand. But you inherit everything the provider used to handle: cold starts after idle, capacity planning, autoscaling, and the engineering time to keep it all running. For steady, high-volume workloads the self-hosted route often wins on both latency and cost. For spiky or low-volume traffic, a managed API usually wins because you’re not paying to keep idle GPUs warm. There’s no universal answer; it’s a function of your traffic shape, your team’s ops capacity, and how much latency control you actually need. Benchmark it on your own prompts before committing — that’s the only test that counts.
Why does the same model feel slower in my app than in the playground?
Several reasons stack up. The playground typically sends short prompts with no retrieved context, so prefill is cheap and TTFT looks great. Your production app probably injects system instructions, conversation history, and RAG context — sometimes thousands of tokens — which inflates prefill and pushes TTFT up before generation even starts. The playground also isn’t competing with your other concurrent users for the same rate limit, so there’s no queueing. Add geographic distance between your servers and the API endpoint, any middleware or proxy hops in your stack, and post-processing on your side, and the gap widens. Then there’s output length: the playground demo might generate 50 tokens while your app asks for 800. The fix is rarely “switch models” — it’s trimming context, caching repeated prompts, streaming responses, parallelizing where possible, and routing to a geographically closer region. Profile each stage separately to find which one is actually the bottleneck.
Does quantization hurt quality enough to matter?
It depends entirely on the task and how aggressively you quantize. Moving from FP16 to INT8 typically costs very little measurable quality on most tasks while improving speed and shrinking memory footprint — many production deployments treat INT8 as a near-free win. Pushing to INT4 saves more and goes faster, but quality degradation becomes more noticeable, especially on tasks requiring precise reasoning, math, or careful instruction-following. For a casual chatbot or content drafting where minor wording differences don’t matter, aggressive quantization is often invisible to users. For legal analysis, code generation, or anything where correctness is non-negotiable, test carefully before dropping precision. The honest approach is to A/B test quantized versus full-precision outputs on your actual task with your own evaluation set, rather than trusting a generic benchmark. Quantization is only available when you control the serving stack for open-weight models — the major managed cloud APIs don’t expose this lever, so this whole question is moot if you’re calling a hosted API.
How does context length affect latency, exactly?
Context length primarily drives the prefill stage, which determines your Time to First Token. The model must encode every token in your prompt before generating a single output token, so a longer prompt means a longer wait before anything streams back. The relationship isn’t perfectly linear because of how attention scales and how serving systems optimize, but the practical pattern holds: bigger context, slower first token. This is why RAG pipelines that aggressively stuff retrieved documents into the prompt can feel sluggish even on fast models — you’re paying a prefill tax on every call. Mitigations include prompt caching (some providers cache the encoded prefix of repeated prompts, dramatically cutting repeat prefill cost), being ruthless about trimming retrieved context to only what’s needed, and summarizing conversation history rather than replaying it verbatim. Output length, by contrast, affects the decode stage and total completion time, not TTFT. Knowing which stage dominates your latency tells you which knob to turn.
Which model is best for low-latency real-time chat?
For pure responsiveness in an interactive chat interface, a speed-optimized cloud variant usually wins because the provider handles autoscaling, keeps capacity warm, and you avoid the operational risk of cold starts. A speed-optimized cloud tier with trimmed context is a reasonable pick where TTFT and streaming smoothness matter more than maximum reasoning depth. A heavier deep-reasoning model leans toward slower but more thorough answers, which is fantastic for complex tasks but may be overkill — and unnecessarily slow — for quick back-and-forth chat. That said, “best” depends on your quality floor: if your chat needs genuinely strong reasoning per turn, a slightly slower but more capable model that gets answers right the first time can produce a better overall experience than a fast model that needs follow-up corrections. Always enable streaming, cache your system prompt, and keep context lean regardless of which model you pick. Those three habits improve perceived latency more than the model choice itself.
Why is my p99 latency so much worse than my average?
Tail latency blowups almost always come from contention and cold starts. Under concurrent load, requests queue waiting for batch slots or rate-limit windows, and the unlucky requests at the back of the line experience multiples of the median latency. On self-hosted setups, a request that arrives when GPUs have scaled down to zero pays a cold-start penalty to spin capacity back up — that single request might take many times longer than a warm one. Garbage collection pauses, network retries, and occasional long outputs (one user asking for a huge response) also push the tail out. The danger is that averages completely hide this: you can have a perfectly healthy median while 1% of users have a miserable experience. To fix it, keep minimum warm capacity to avoid cold starts, set sane max-output caps, smooth out traffic spikes with queuing you control, and monitor p95/p99 as first-class metrics. If your p99 is several times your median, you have a tail problem worth engineering around, not a model problem.
Should I switch models to fix latency, or is it usually something else?
In most cases I’d look everywhere else before swapping models. The biggest, cheapest latency wins typically come from your own pipeline: enabling streaming so users see output immediately, trimming bloated context and system prompts, adding prompt caching for repeated prefixes, routing requests to a geographically closer region, parallelizing independent steps in agent workflows, and capping output length to what you actually need. These changes often cut perceived latency dramatically without touching the model. Switching models is worth it when you’ve genuinely hit a model-specific ceiling — for example, you need self-hosting control and quantization that only open-weight models you run yourself provide, or your current model’s reasoning is so unreliable that retries are inflating your total latency. The diagnostic move is to profile each stage of your request separately: network, queue, prefill, decode. Find the dominant cost first. More teams waste money chasing a faster model when their real problem was 6,000 tokens of unnecessary context on every call.
Last updated: 2026
Found this review helpful?
👉 Browse the AI Tools Library to find the right tools for your workflow.
Related reading: Claude Fable 5 Hands-On: A Look at High Effort Mode in claude.ai (2026)