The Benchmark Score You’re Reading Is Probably Lying to You
Here’s something that took me embarrassingly long to figure out: when a model lab announces “we scored 88% on MMLU,” that number tells you almost nothing about whether the thing will be fast enough, cheap enough, or accurate enough for what you’re actually building. I’ve watched startups pick a model based purely on a leaderboard ranking, deploy it, and then discover their users were staring at a spinner for four seconds before the first word appeared. The benchmark was great. The experience was miserable.
The dirty secret of AI performance metrics is that there isn’t one number that matters — there are at least three categories of numbers, they measure completely different things, and most people conflate all of them into a vague sense of “this model is good.” Quality scores, latency, and throughput are three separate axes, and a model can be brilliant on one while being a disaster on another. A reasoning model that aces graduate-level science questions might take 30 seconds to think before answering, which is fine for research and catastrophic for a customer-facing chatbot.
So let’s actually break down what these metrics measure, why two reputable benchmarks can rank the same model differently, and how the evaluation landscape in 2026 looks genuinely different from where it was a couple of years ago. By the end, you’ll be able to read a model card or a leaderboard and know which numbers to trust for your specific use case — and which to politely ignore.
Contents
The Three Axes Nobody Separates Properly
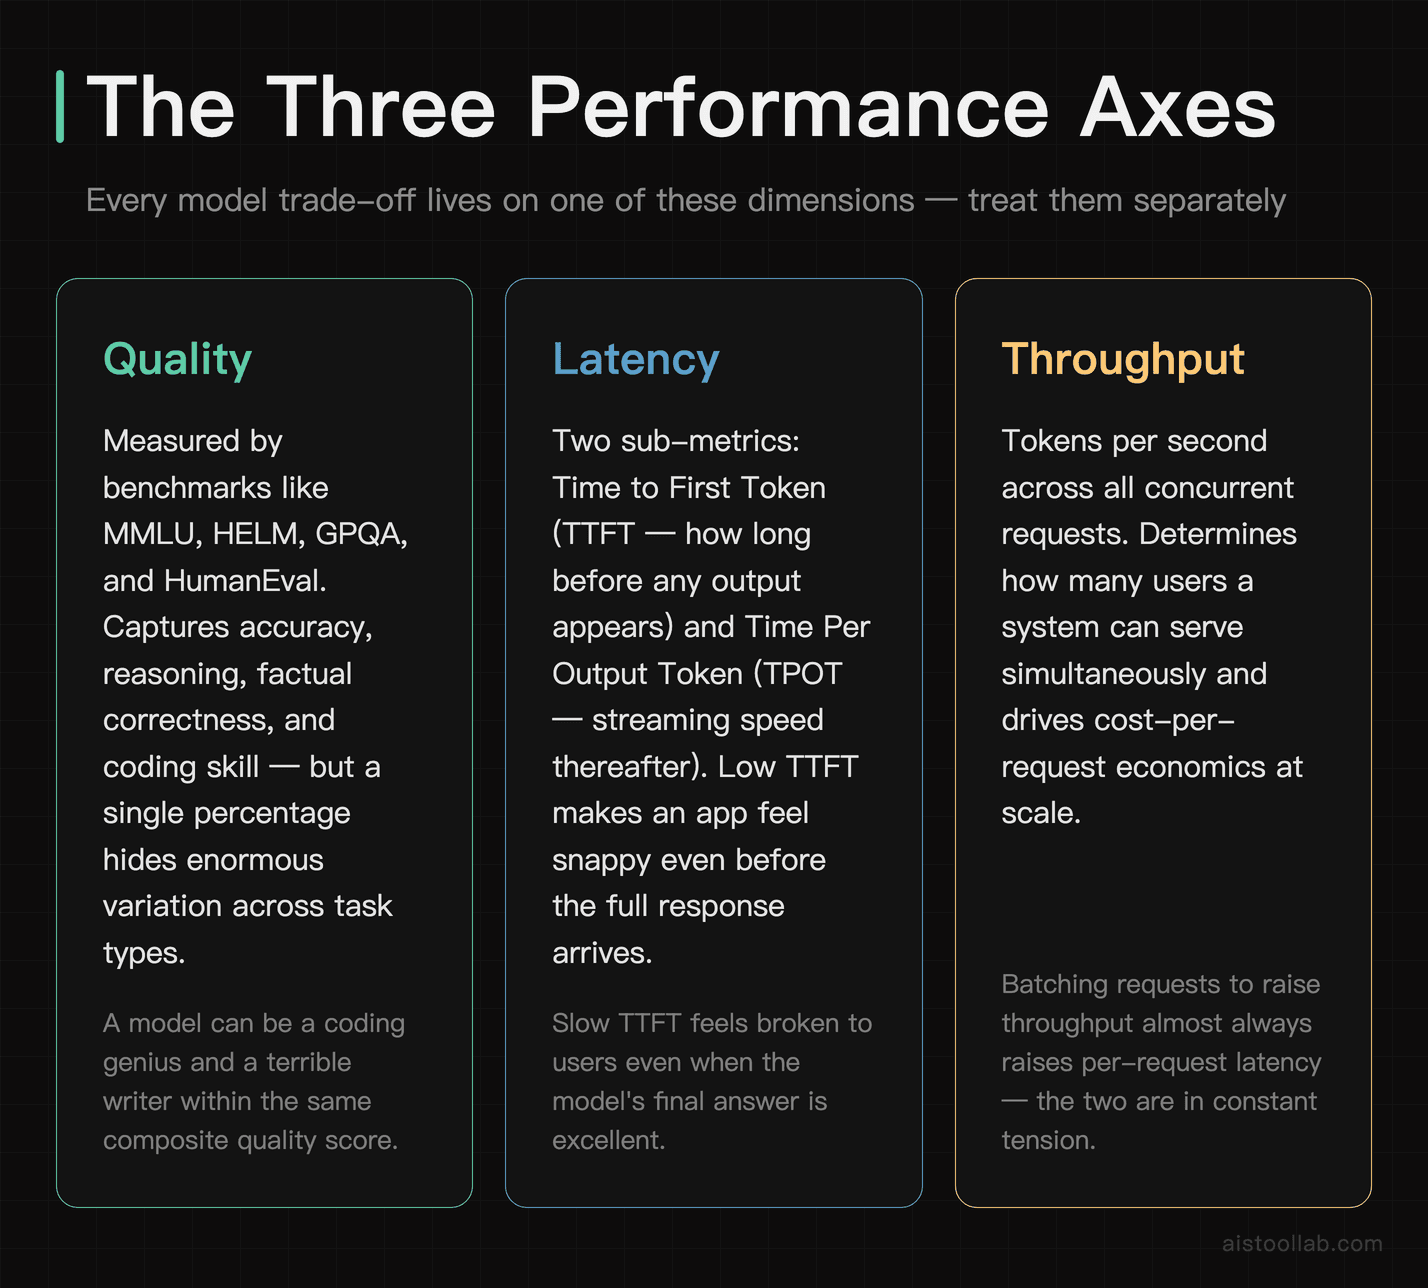
Every meaningful conversation about model performance comes down to three independent dimensions. Treat them as one blob and you’ll make bad decisions. Treat them separately and suddenly the trade-offs become obvious.
Quality (how good are the answers?) — This is what benchmarks like MMLU, HELM, GPQA, and HumanEval try to capture. They measure accuracy, reasoning ability, factual correctness, coding skill, and so on. Quality is the most discussed metric and the most misunderstood, because a single percentage hides enormous variation across task types. A model can be a coding genius and a terrible writer.
Latency (how long until I see something?) — This breaks into two sub-metrics that matter enormously for real apps. Time to first token (TTFT) is how long you wait before the very first word appears. Time per output token (TPOT, sometimes called inter-token latency) is how fast the rest of the response streams out after that. A model with low TTFT feels snappy even if it’s not the smartest, because humans perceive responsiveness more than raw completion speed.
Throughput (how much can it handle at scale?) — Usually measured in tokens per second across all concurrent requests, or requests served per second. This is the metric that determines your cloud bill. A serving setup that handles many parallel requests efficiently costs dramatically less per user than one that chokes under load. Throughput and latency are often in tension: batching more requests together raises throughput but can hurt individual latency.
Here’s the thing that trips people up — these three rarely move together. Quantizing a model (compressing its weights) usually boosts throughput and cuts latency but nudges quality down a touch. Adding chain-of-thought reasoning boosts quality on hard problems but tanks latency because the model is generating thousands of “thinking” tokens before it answers. There’s no free lunch, only trade-offs you choose deliberately or stumble into accidentally.
Why Two Benchmarks Disagree About the Same Model
If you’ve ever seen a model ranked #1 on one leaderboard and #5 on another, you’re not imagining it. The methodology behind each benchmark introduces real variance, and understanding that variance is the difference between reading benchmarks like a pro and getting fooled by marketing.
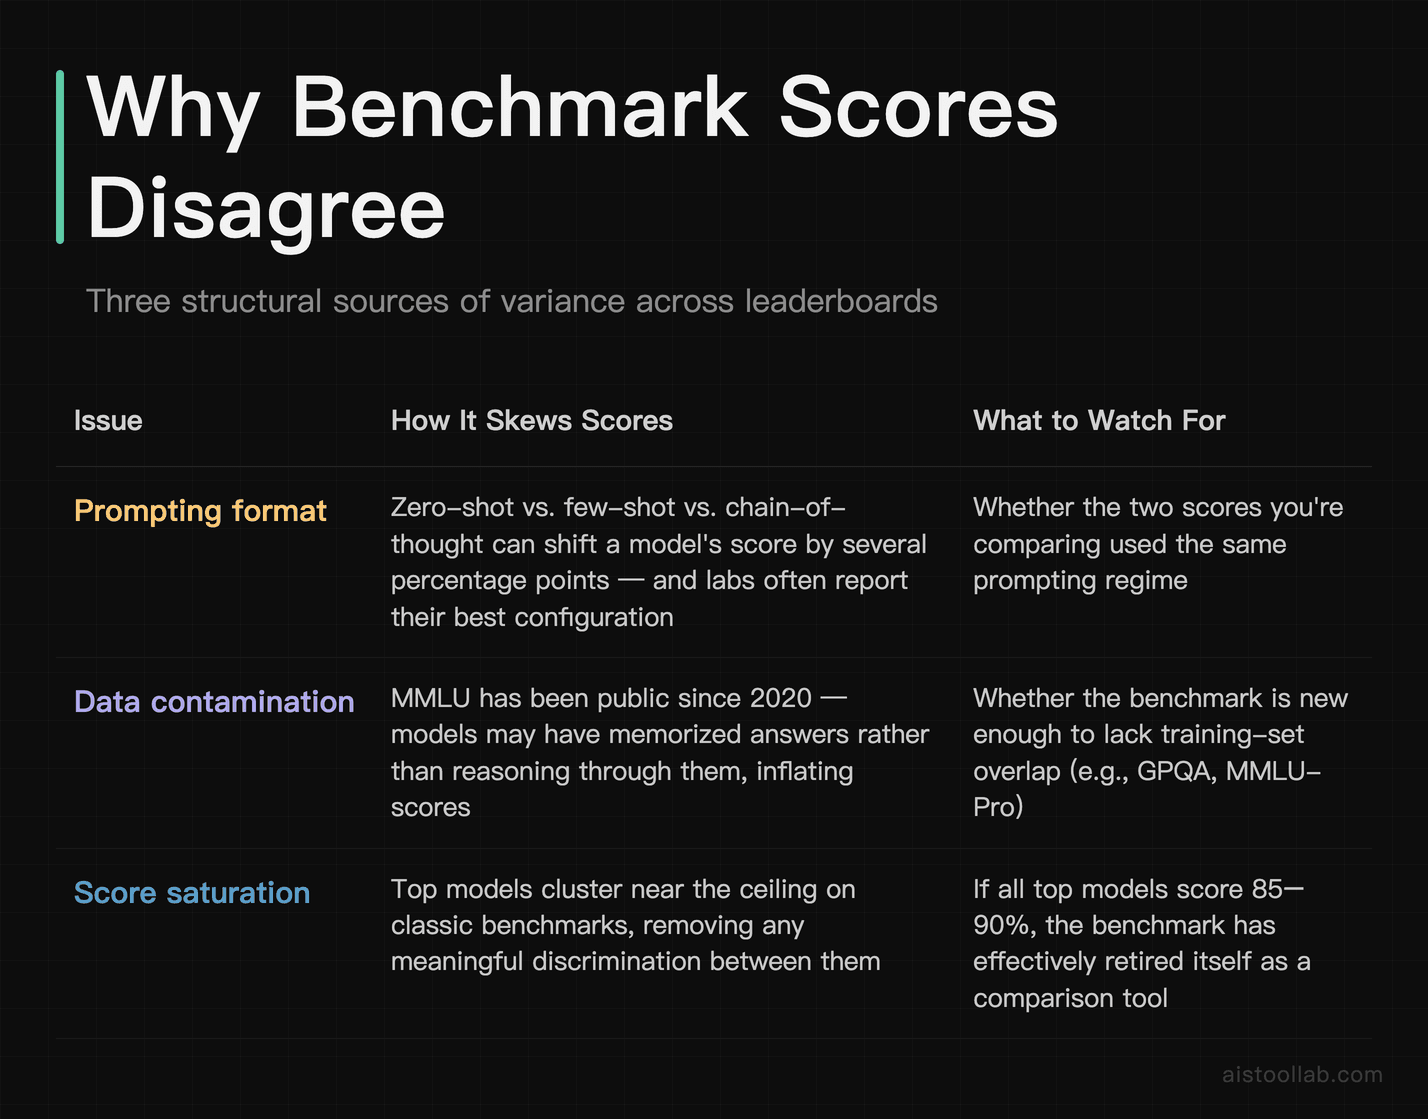
Prompting format matters more than you’d think. MMLU is multiple-choice. How you present those choices — zero-shot, few-shot, with or without chain-of-thought — can swing a model’s score by several points. Some labs report their best configuration; others report a standardized one. When you compare two scores measured under different prompting regimes, you’re comparing apples to a slightly different apple.
Contamination is a genuine problem. MMLU has been public since 2020 (originally from Hendrycks and colleagues), which means its questions have almost certainly leaked into training data across the industry. A model might “know” answers because it memorized the test, not because it reasoned through them. This is exactly why harder, newer benchmarks like MMLU-Pro (which expands answer options and increases difficulty) and GPQA (deliberately “Google-proof” graduate questions) exist — they’re attempts to outrun contamination.
Different benchmarks measure different skills. HELM, from Stanford’s Center for Research on Foundation Models, was explicitly designed as a holistic evaluation — it scores models across many scenarios and metrics (accuracy, robustness, fairness, efficiency) rather than collapsing everything into one number. That’s a fundamentally different philosophy from a single-task leaderboard. Comparing a HELM ranking to an MMLU ranking is comparing two different worldviews about what “good” even means.
My rule of thumb: never trust a single benchmark. Look at a spread of them, weight the ones that match your actual workload, and treat any score within a couple of points of another as effectively tied. The error bars on these things are wider than the marketing suggests.
What Changed Between 2024 and 2026
The evaluation landscape genuinely shifted over the past two years, and not just because models got bigger. The whole framework for what we measure evolved.
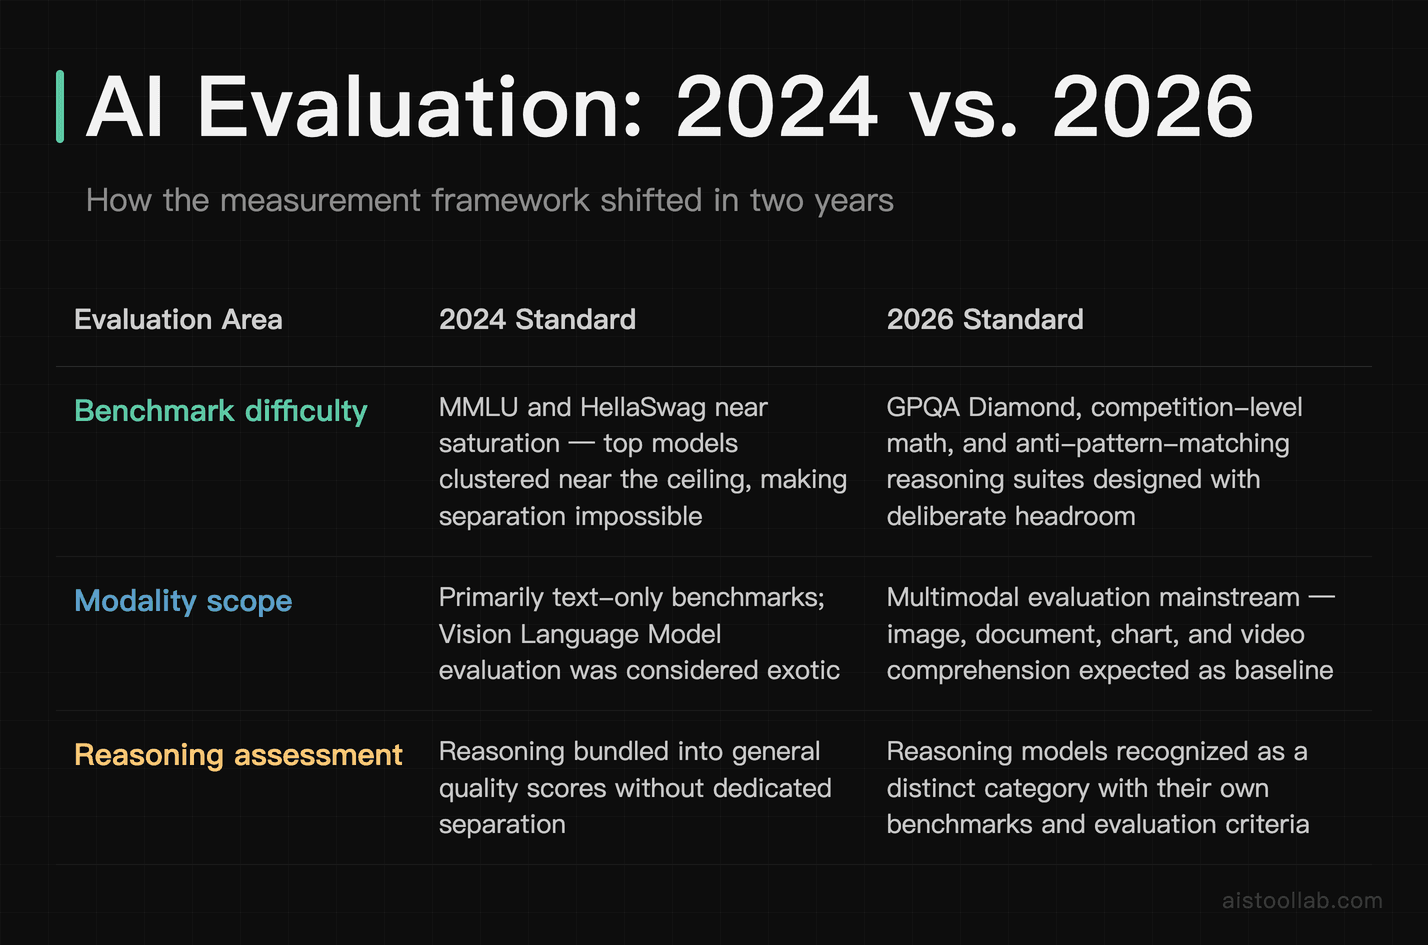
Saturation forced harder benchmarks. By 2024, top models were scoring so high on classic benchmarks like MMLU and HellaSwag that the tests stopped distinguishing between them — everyone was clustered near the ceiling. The response has been a wave of deliberately brutal benchmarks designed to have headroom: GPQA Diamond for graduate science, competition-level math benchmarks, and reasoning suites that can’t be solved by pattern-matching alone. When a benchmark is saturated, it’s useless for comparison, and a lot of 2024-era favorites are effectively retired for top-tier comparison now.
Multimodal evaluation went mainstream. As Vision Language Models Explained became standard rather than exotic, text-only benchmarks stopped telling the whole story. Modern evaluation increasingly tests image understanding, document parsing, chart reading, and video comprehension. A model that’s a text wizard but can’t read a graph is no longer “good” by 2026 standards — it’s incomplete.
Reasoning got its own category. The rise of reasoning models — the ones that generate extended “thinking” before answering — created a new evaluation challenge. You can’t fairly measure these with the same speed metrics as a standard model, because their whole value proposition is trading latency for correctness on hard problems. New frameworks increasingly report quality-at-a-latency-budget rather than quality alone. This ties directly into how Agentic AI Systems Explained get evaluated, since agents chain many reasoning steps together and small per-step errors compound fast.
Real-world inference metrics got serious attention. Two years ago, latency and throughput were afterthoughts in most model announcements. Now they’re front and center, partly because the cost of serving these models at scale became impossible to ignore. The community started caring about tokens-per-dollar and TTFT under realistic concurrent load, not just lab-condition speed.
The Tools You Actually Use to Measure This Stuff
Theory is nice, but at some point you need to run the numbers yourself — because your workload, your hardware, and your prompts are not the lab’s. Here’s what the ecosystem looks like and where each tool fits.
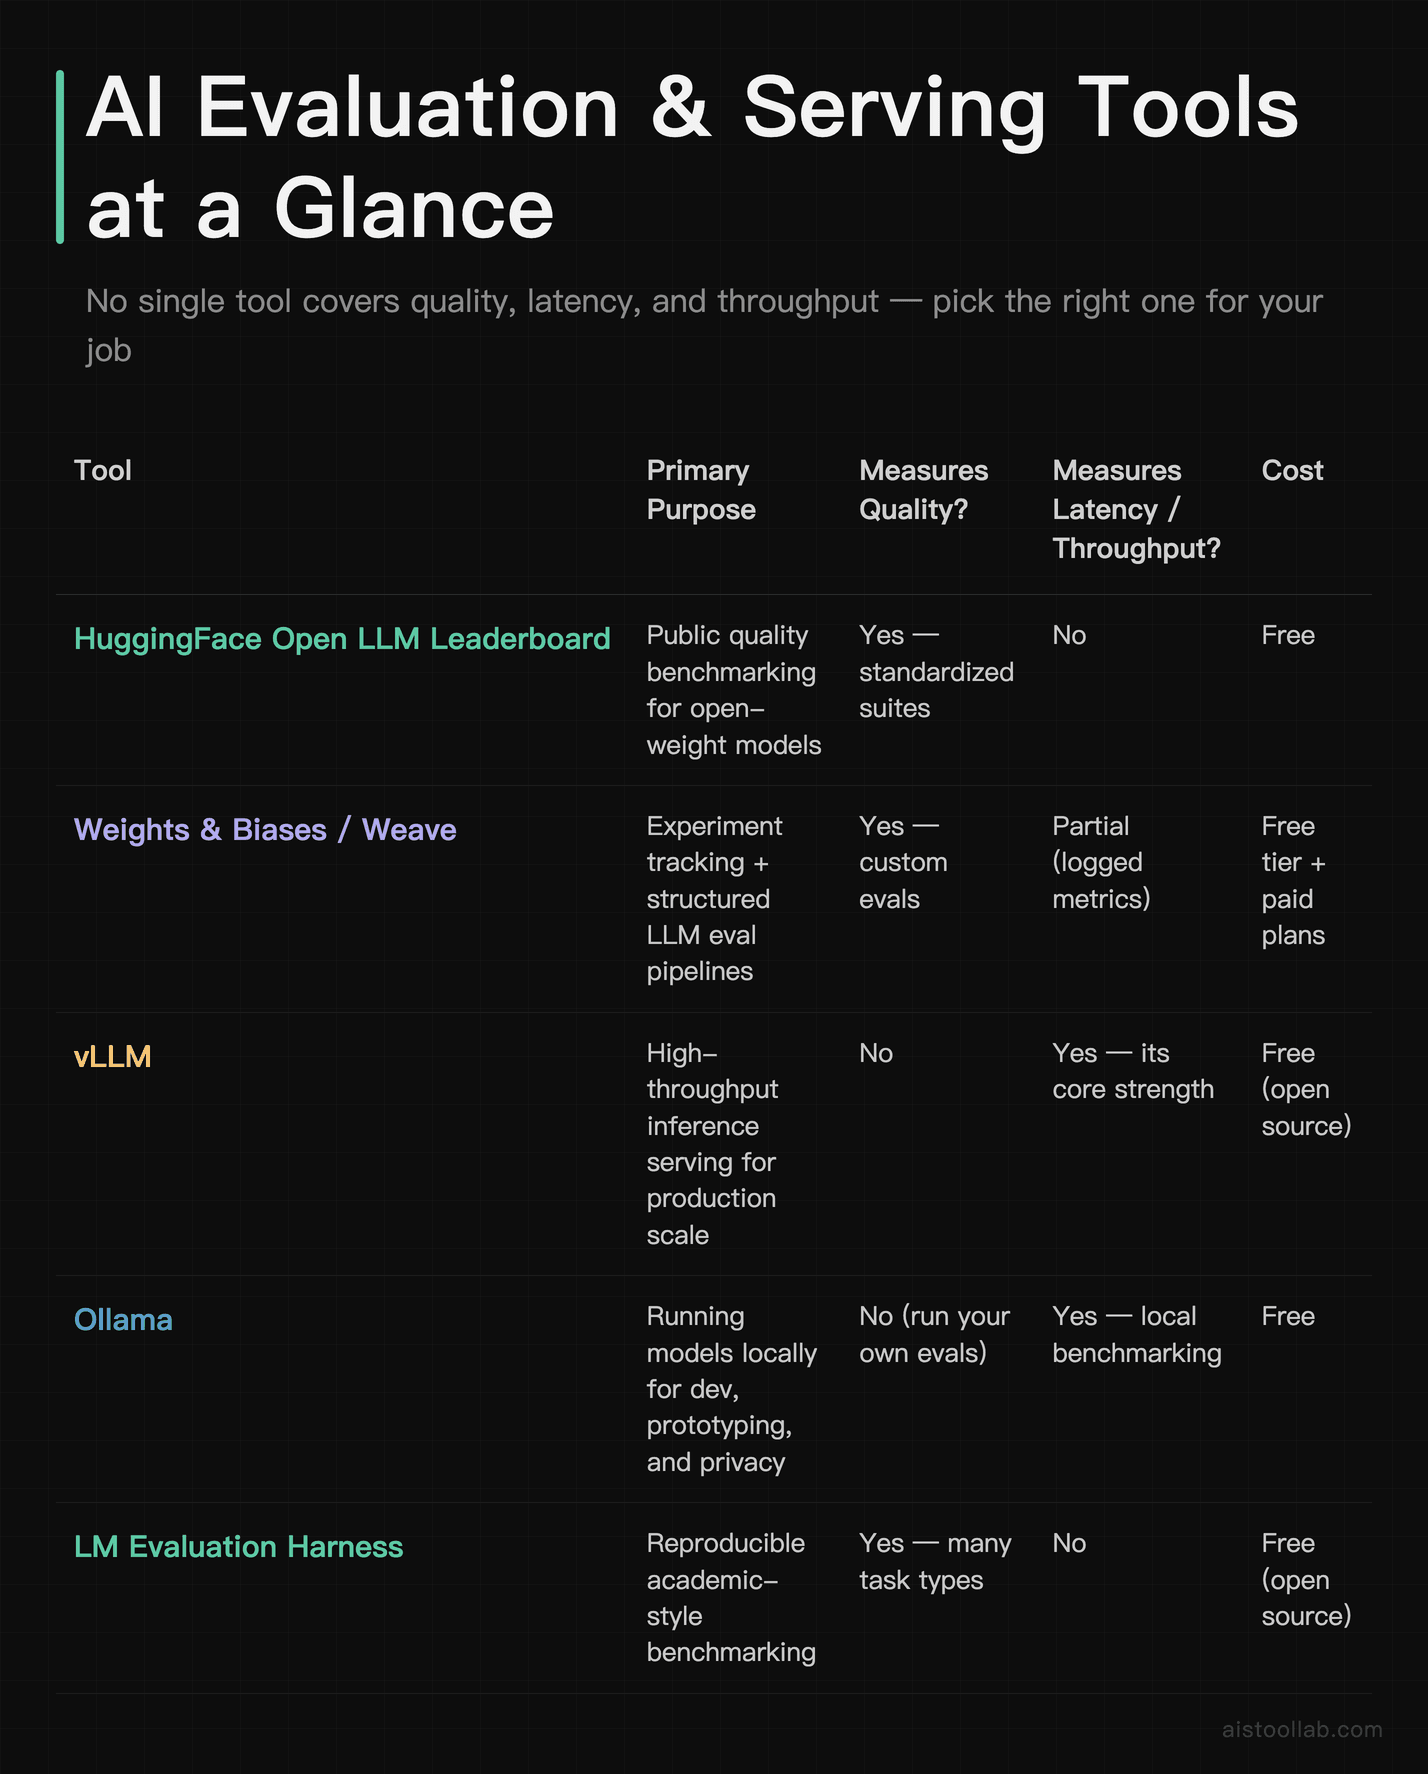
The pattern here is important: no single tool does everything. HuggingFace’s leaderboard and the LM Evaluation Harness handle quality. vLLM and Ollama handle speed and serving. Weights & Biases ties it together for teams that want to track everything over time. If you’re serious, you’ll end up using at least two of these — one for quality, one for performance. I dug deeper into the leaderboard side of this in my Open LLM Leaderboard Review 2026, which is worth a read if you’re choosing between open-weight models specifically.
Who Actually Needs to Measure This — Three Real Scenarios
The solo developer shipping a customer-facing chatbot
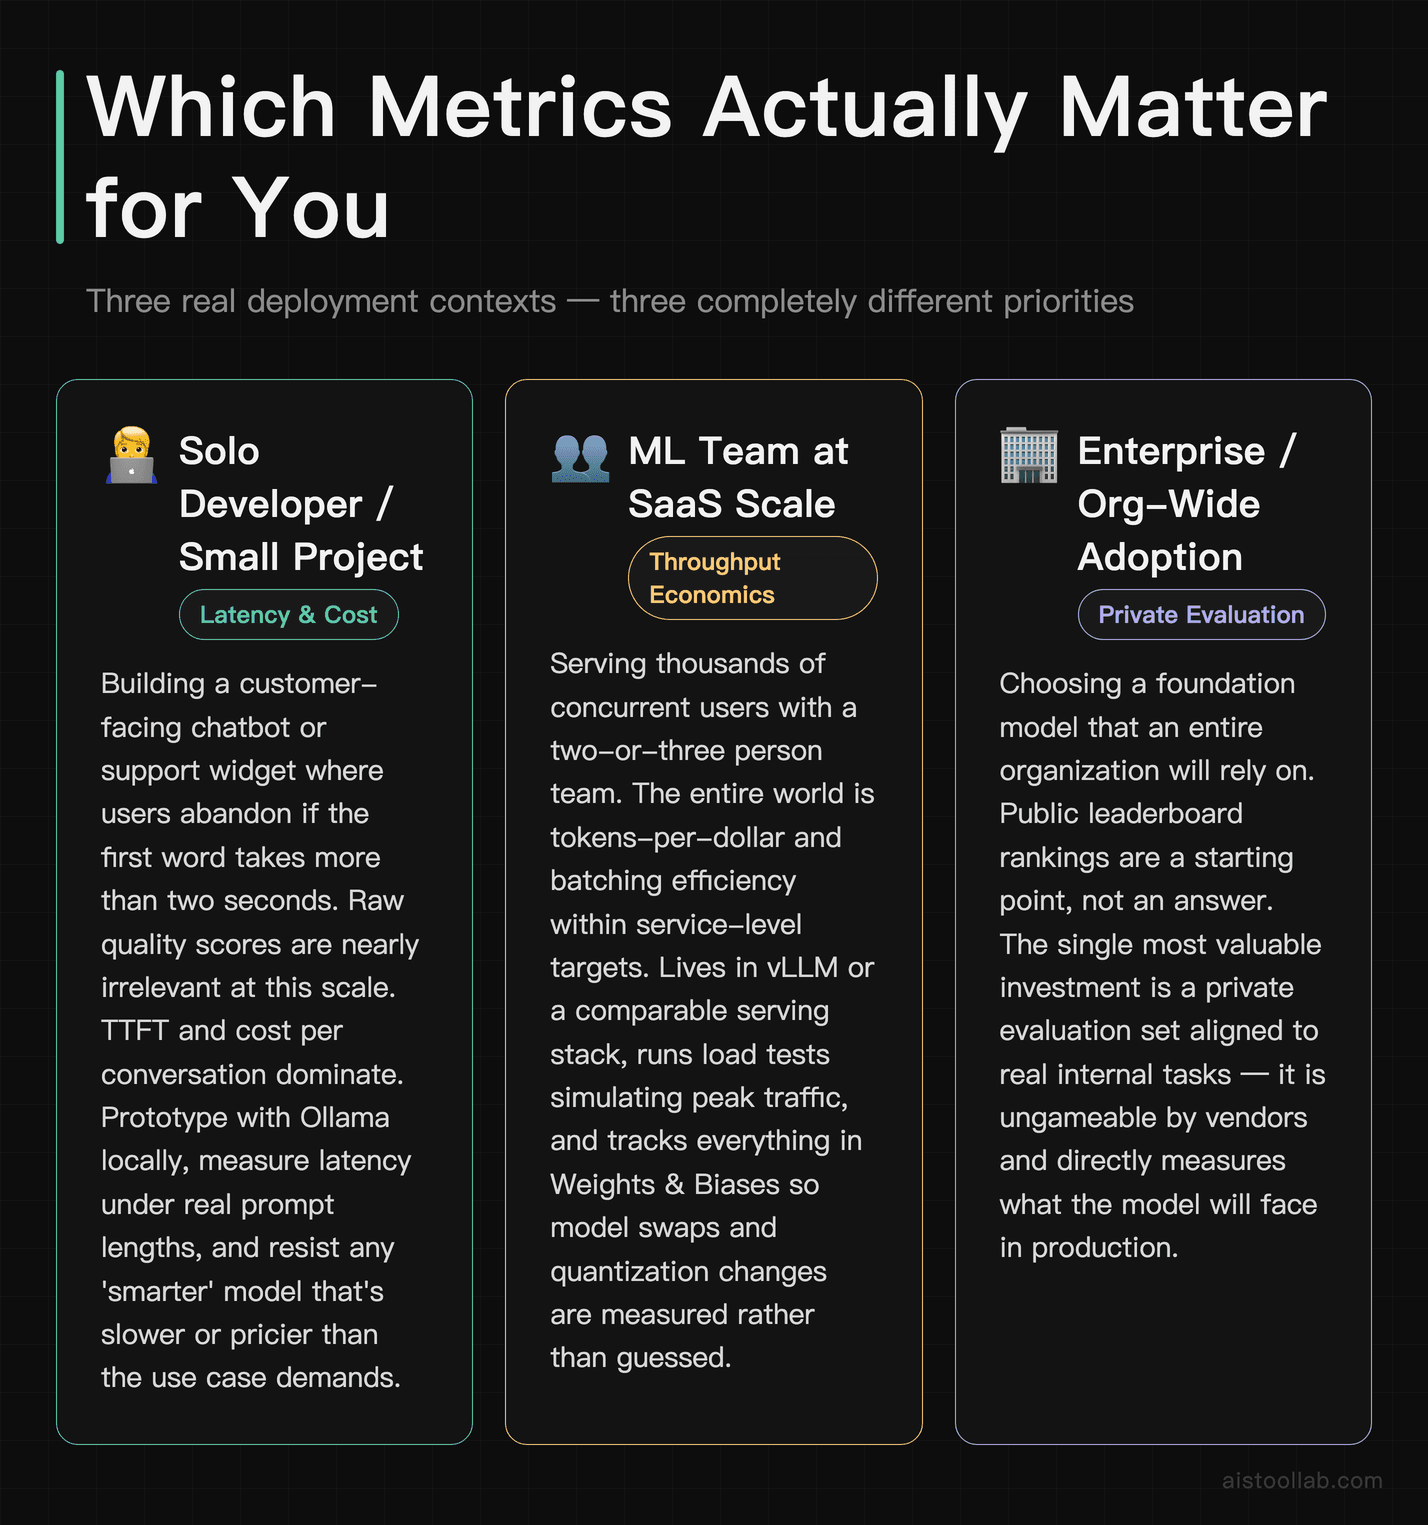
Picture a freelance developer building a support bot for a small e-commerce client. For this person, raw quality scores are almost a distraction — the questions users ask aren’t graduate-level physics. What matters is TTFT, because a support widget that takes four seconds to respond feels broken, and cost per conversation, because the client is on a tight budget. This developer should be running Ollama locally to prototype, then measuring real latency under their actual prompt lengths. A “smarter” model that’s slower and pricier would be the wrong call here, even if it ranks higher on every leaderboard.
The ML team at a SaaS startup deploying at scale
Now imagine a two-or-three person ML team serving thousands of concurrent users. Their entire world is throughput economics. They care about tokens-per-dollar and how many requests they can batch without latency exceeding their service-level target. This team lives in vLLM (or a comparable serving stack), runs load tests that simulate peak traffic, and uses Weights & Biases to track whether a model swap or a quantization change moved the cost needle. For them, a 1% quality drop that halves the serving bill is often an easy yes.
The researcher or technical evaluator choosing a foundation model
Finally, consider someone at a larger org tasked with picking the model the whole company will build on. This person needs rigorous, contamination-aware quality measurement across a spread of benchmarks — the LM Evaluation Harness and harder suites like GPQA and MMLU-Pro — plus their own private eval set that the model labs have never seen. The private eval is the secret weapon: it’s the one number nobody can game. I leaned heavily on this approach when I put together my ranking of the best LLMs comparison.
Frequently Asked Questions
What’s the difference between latency and throughput, in plain English?
Latency is about one user’s experience: how long does it take to get my answer? Throughput is about the system’s capacity: how many users can it serve at once? Think of a coffee shop. Latency is how long you personally wait for your latte. Throughput is how many lattes the shop makes per hour across all customers. A barista who hand-crafts one perfect drink at a time has great quality and terrible throughput; a machine pumping out hundreds of mediocre cups has the opposite. In AI serving, the two are in constant tension because batching more requests together (to raise throughput) can make any single request wait longer (raising latency). The right balance depends entirely on your use case. A real-time chatbot prioritizes low latency so each message feels instant. A nightly batch job that summarizes thousands of documents prioritizes throughput because no human is waiting — you just want the whole pile processed as cheaply as possible.
Why do benchmark scores keep changing for the “same” model?
Several reasons, and most of them are about methodology rather than the model itself changing. The prompting format — zero-shot versus few-shot, with or without chain-of-thought reasoning — can shift a score by multiple points. The exact version of the benchmark matters too, since many of them get updated to remove contaminated or ambiguous questions. The evaluation harness implementation can differ between organizations, leading to slightly different parsing of answers. And labs sometimes report their best-case configuration while independent evaluators report a standardized one. On top of all that, models with any randomness in their sampling will produce slightly different outputs run to run. The practical takeaway: treat any benchmark number as approximate, with error bars wider than the marketing implies. If two models are within a couple of points of each other, consider them tied and decide based on something that actually differentiates them — speed, cost, or performance on your own test set.
Is MMLU still worth paying attention to in 2026?
It’s useful as a baseline but increasingly stale as a differentiator. MMLU has been public since 2020, which means its questions have very likely leaked into training data across the industry — a problem called contamination. When a model has effectively seen the test answers during training, a high score reflects memorization as much as reasoning. On top of that, top models have largely saturated MMLU, clustering near the ceiling where the test can no longer separate them meaningfully. That’s why the field moved toward harder, newer benchmarks like MMLU-Pro (which adds more answer choices and tougher questions) and GPQA (graduate-level, deliberately designed to resist simple lookup). I still glance at MMLU as a sanity check — a model that scores poorly on it has real problems — but I’d never pick between two strong models based on MMLU alone. For current comparison, you want benchmarks with headroom and lower contamination risk.
What is time to first token (TTFT) and why does everyone obsess over it?
TTFT is the delay between sending your prompt and seeing the very first word of the response appear. It matters disproportionately because of human psychology: people perceive responsiveness based on when something starts happening, not when it finishes. A response that begins streaming in half a second feels fast even if the full answer takes ten seconds to complete, while a response that makes you stare at a blank screen for three seconds feels broken even if it then dumps the whole answer instantly. For any interactive application — chatbots, coding assistants, search — TTFT is often the single most important performance metric for perceived quality. It’s heavily influenced by how long your input prompt is (the model has to process all of it before generating), the serving infrastructure, and whether the request had to wait in a queue. If your app feels sluggish, TTFT is usually the first thing to investigate, well before you start questioning the model’s intelligence.
Should I use vLLM or Ollama for testing model performance?
They solve different problems, so the answer depends on your goal. Ollama is built for ease — you can have a model running locally on your laptop within minutes, which makes it fantastic for prototyping, private testing, and getting a rough feel for a model’s speed and behavior without sending data to any cloud. It’s the tool I reach for when I just want to poke at something quickly. vLLM is built for serious serving: it uses techniques like PagedAttention to maximize throughput and handle many concurrent requests efficiently, which is what you want when you’re deploying to production and the cloud bill is real money. If you’re a solo developer experimenting or a privacy-conscious user keeping everything local, start with Ollama. If you’re an ML team measuring how a model behaves under realistic concurrent load before deploying it to thousands of users, vLLM is the standard. Many teams use both: Ollama for local iteration, vLLM for the production load tests that actually predict cost.
How do I evaluate a reasoning model fairly against a standard one?
This is genuinely tricky because they make different trade-offs. Reasoning models generate extended internal “thinking” — sometimes thousands of tokens — before producing their final answer, which dramatically improves accuracy on hard problems like math and logic but also increases latency and cost. Comparing one purely on latency against a standard model is unfair, because you’re penalizing it for the very thing that makes it good. The better approach is to measure quality at a fixed latency or cost budget: given X seconds or Y cents per query, which model delivers better answers on your task? On easy queries, a standard model often wins because the reasoning overhead is wasted. On genuinely hard, multi-step problems, the reasoning model can pull far ahead. Some 2026 evaluation frameworks now report this trade-off curve explicitly rather than collapsing everything into one number. Match the model to the difficulty of your actual workload — using a heavy reasoning model for simple FAQ lookups is just burning money and time.
Are the public leaderboards trustworthy, or are they gamed?
Mixed, and you should treat them with healthy skepticism. The well-maintained ones — like HuggingFace’s Open LLM Leaderboard or Stanford’s HELM — use standardized, transparent methodology, which makes them genuinely useful for apples-to-apples comparison of open models. But several real problems exist. Contamination means models may have trained on test data, inflating scores. Some labs optimize specifically for benchmark performance (“teaching to the test”) in ways that don’t generalize to real tasks. And human-preference leaderboards can be influenced by stylistic factors — a model that writes confidently and verbosely sometimes wins votes over a more accurate but terser one. None of this makes leaderboards worthless; it makes them one input among several. My advice is to use them to build a shortlist, then validate the finalists against your own private evaluation set — questions the labs have never seen and couldn’t have trained on. That private set is the most honest number you’ll ever get, because it’s the only one nobody can game ahead of time.
What metrics matter most if I’m just building a small project?
For most small projects, you can ignore the leaderboard arms race entirely and focus on three practical things. First, latency — specifically TTFT — because nothing kills a small app’s feel faster than sluggish responses; aim for something that starts replying within a second or so. Second, cost, because small projects usually run on small budgets and token pricing adds up faster than people expect once you have real usage. Third, quality on your specific task, which you measure not with MMLU but by actually running your real prompts and reading the outputs critically. A model that’s mid-tier on global benchmarks but fast, cheap, and reliably good at your one narrow task will serve you far better than a benchmark champion that’s slow and expensive. I’d start with Ollama to test a few candidates locally for free, pick the one that feels right, and only worry about throughput and serving infrastructure if and when the project actually gets traction. Premature optimization for scale you don’t have is a classic trap.
My Take: Stop Reading Benchmarks Like Box Scores
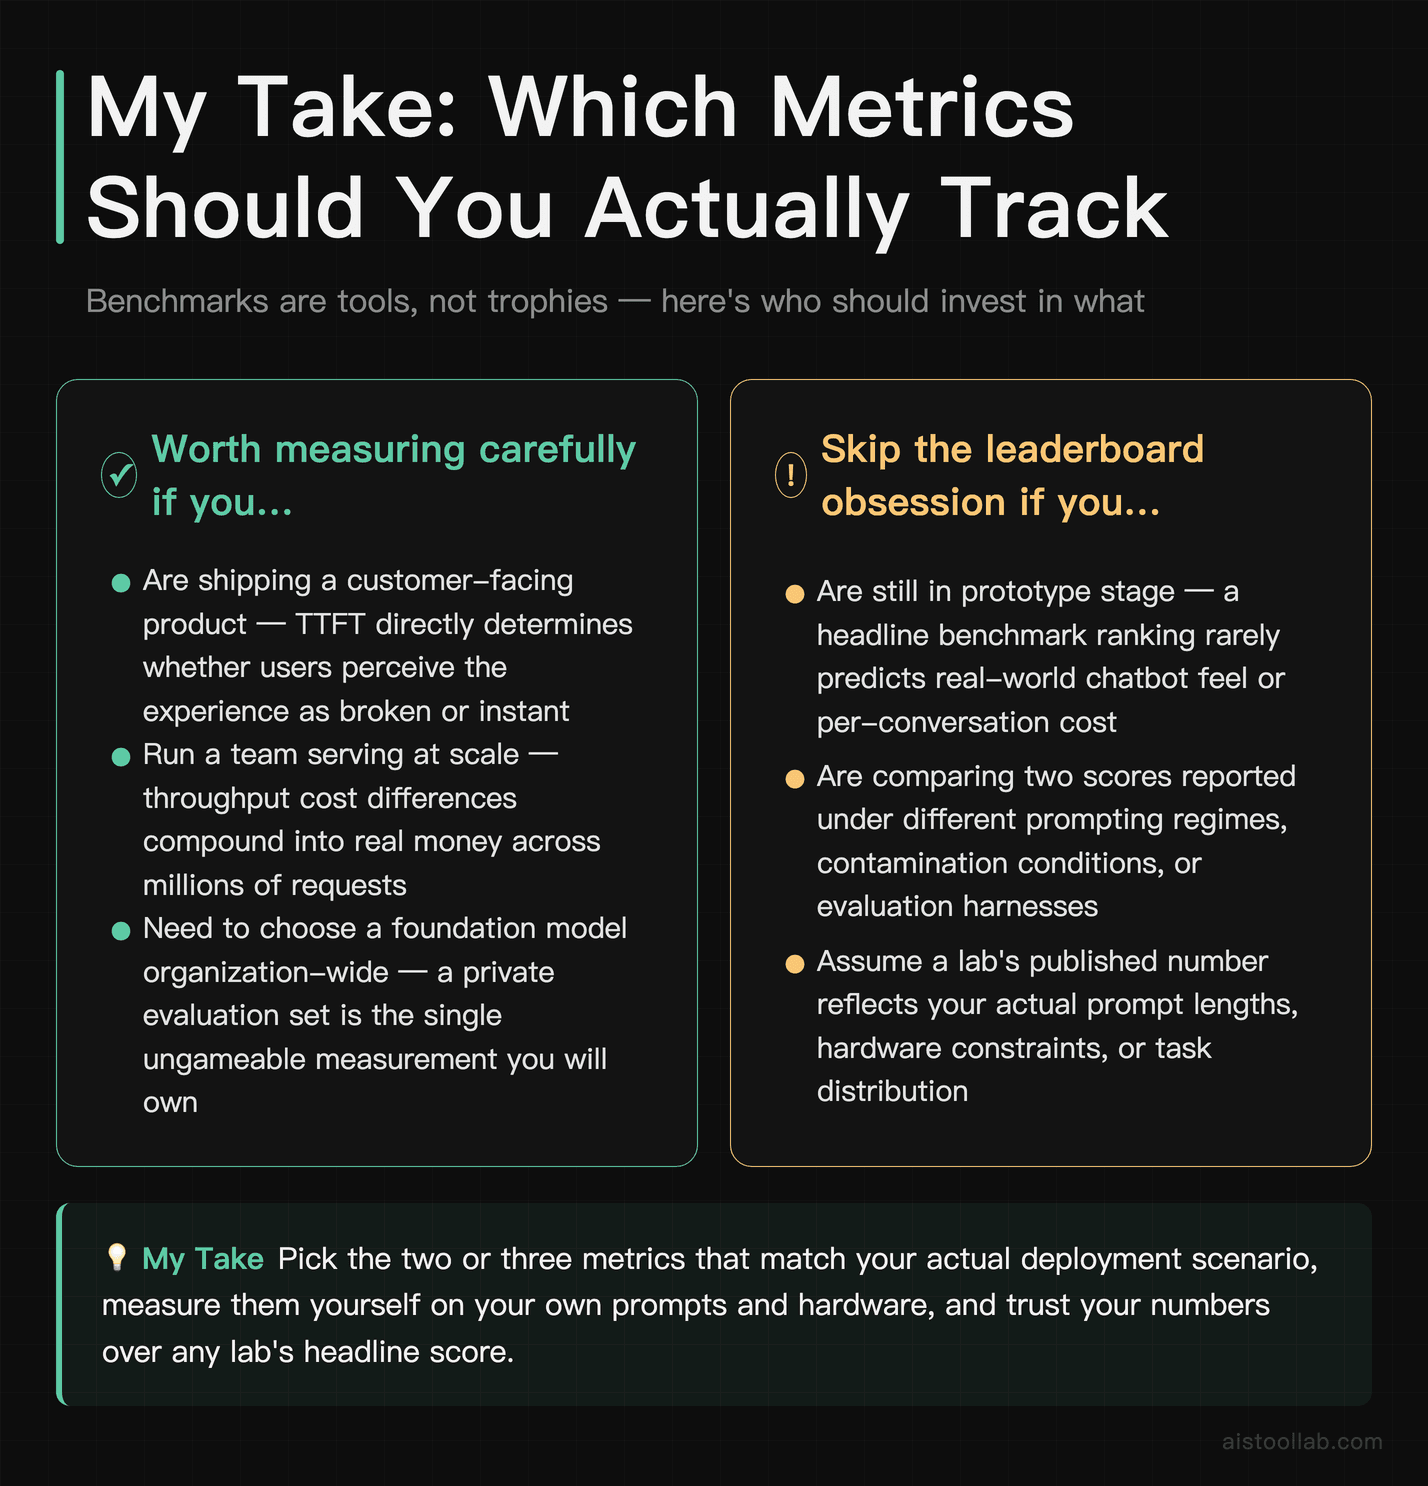
If there’s one habit I’d push you to drop, it’s treating a single benchmark number as a verdict. These metrics are tools, not trophies, and each one answers a narrow question. Quality scores tell you whether a model can reason; latency tells you whether it’ll feel good to use; throughput tells you whether you can afford to run it. A model that wins on all three at once is rare, and usually you’re choosing which trade-off hurts least for your particular situation.
My honest recommendation depends on who you are. If you’re a solo builder or running a small project, ignore the leaderboard horse race almost entirely — run a couple of models locally with Ollama, measure how fast they start responding, check the cost, and trust your own eyes on quality. If you’re on a team deploying at scale, invest the time to set up proper throughput testing with vLLM and track everything in Weights & Biases, because at scale the cost differences compound into real money. And if you’re choosing a foundation model for a whole organization, build a private evaluation set today — it’s the single most valuable, ungameable measurement you’ll ever own.
The labs will keep releasing impressive numbers. Your job is to know which of those numbers actually apply to you, and to verify the rest yourself. That skill — reading metrics critically instead of swallowing them whole — is worth more than any single model choice.
Last updated: 2026
Explore more AI tools
👉 Browse the AI Tools Library to find the right tools for your workflow.